Archives by Month:
- January 2025
- December 2024
- November 2024
- October 2024
- September 2024
- August 2024
- July 2024
- June 2024
- May 2024
- April 2024
- March 2024
- January 2024
- December 2023
- November 2023
- October 2023
- August 2023
- July 2023
- June 2023
- May 2023
- February 2023
- January 2023
- December 2022
- November 2022
- October 2022
- September 2022
- August 2022
- July 2022
- June 2022
- May 2022
- April 2022
- March 2022
- February 2022
- January 2022
- December 2021
- November 2021
- October 2021
- September 2021
- August 2021
- July 2021
- June 2021
- May 2021
- April 2021
- March 2021
- February 2021
- January 2021
- December 2020
- November 2020
- October 2020
- September 2020
- August 2020
- July 2020
- June 2020
- May 2020
- April 2020
- March 2020
- February 2020
- January 2020
- December 2019
- December 2018
- November 2018
- October 2018
- September 2018
- August 2018
- July 2018
- June 2018
- May 2018
- April 2018
- March 2018
- February 2018
- January 2018
- December 2017
- November 2017
- October 2017
- September 2017
- August 2017
- July 2017
- June 2017
- May 2017
- April 2017
- March 2017
- February 2017
- January 2017
- December 2016
- November 2016
- October 2016
- September 2016
- July 2016
- June 2016
- April 2016
- March 2016
- February 2016
- January 2016
- December 2015
- November 2015
- October 2015
- September 2015
- August 2015
- July 2015
- June 2015
- May 2015
- April 2015
- March 2015
- February 2015
- January 2015
- December 2014
- November 2014
- October 2014
- September 2014
- August 2014
- July 2014
- June 2014
- May 2014
- April 2014
- March 2014
- February 2014
- January 2014
- December 2013
- November 2013
- October 2013
- September 2013
- August 2013
- July 2013
- June 2013
- May 2013
- April 2013
- March 2013
- February 2013
- January 2013
- November 2012
- October 2012
- August 2012
- July 2012
- June 2012
- May 2012
- April 2012
- March 2012
- February 2012
- January 2012
- December 2011
- November 2011
- October 2011
- September 2011
- August 2011
- July 2011
- June 2011
- May 2011
- April 2011
- March 2011
- February 2011
- January 2011
- December 2010
- November 2010
- October 2010
- September 2010
- August 2010
- July 2010
- June 2010
- May 2010
- April 2010
- March 2010
- February 2010
- January 2010
- December 2009
- November 2009
- October 2009
- September 2009
- August 2009
- June 2009
- April 2009
- February 2009
- December 2008
- November 2008
- October 2008
- August 2008
- June 2008
- May 2008
Archives by Year:
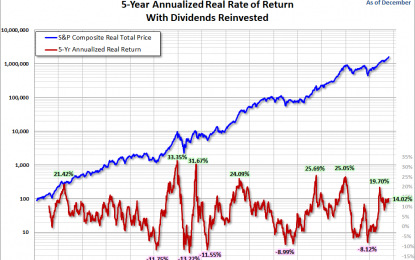
The Latest Look At The Total Return Roller Coaster – Thursday, Jan. 4
Jan 04, 2018 Jeremy Parkinson Finance 0
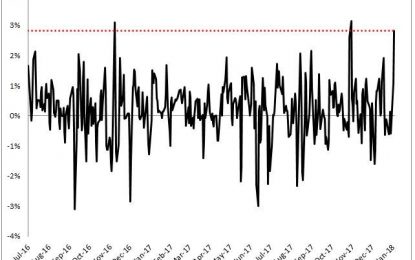
Junk Bond Spreads The 4th Tightest To Start A Year Since 1998
Jan 04, 2018 Jeremy Parkinson Finance 0
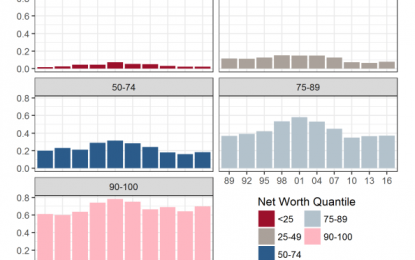
Dear America: Here’s What Egregious Wealth And Income Inequality Looks Like
Jan 04, 2018 Jeremy Parkinson Finance 0

5 Best Performing Growth Mutual Funds In 2017
Jan 04, 2018 Jeremy Parkinson Finance 0

Can Lachmann’s Arbitrage Save The Austrian Theory Of The Interest Rate?
Jan 04, 2018 Jeremy Parkinson Finance 0
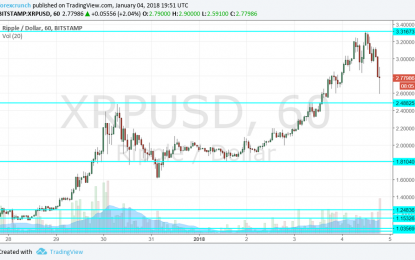
Ripple Price Tumbles Under $3 As Coinbase Denies Inclusion Rumors – A Buy Opportunity?
Jan 04, 2018 Jeremy Parkinson Finance 0
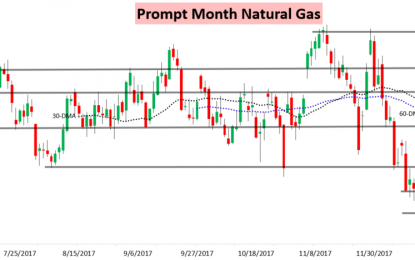
Natural Gas Prices Tumble Off Less Supportive EIA Data And Warmer Weather Trends
Jan 04, 2018 Jeremy Parkinson Finance 0
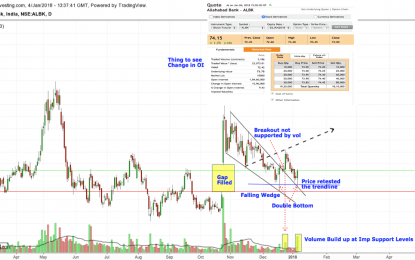
Chart Analysis – Allahabad Bank
Jan 04, 2018 Jeremy Parkinson Finance 0
A Couple Of Short Ideas
Jan 04, 2018 Jeremy Parkinson Finance 0

This Chart Shows Why The Stock Market Isn’t Overvalued
Jan 04, 2018 Jeremy Parkinson Finance 0


