Key Takeaways
- Bitcoin and Ethereum kicked off the weekly trading session in a precarious position.
- The bulls must hold BTC above $29,600 to avoid a 40% price drop.
- ETH needs to keep $1,700 as support to prevent a test of the 2018 all-time high.
Roughly $98 billion has been wiped off the entire cryptocurrency market in the past 24 hours as Bitcoin dipped below $30,000, while Ethereum reached $1,700. The leading cryptocurrencies may be poised for lower lows.
Bitcoin Sits on Thin Ice
Bitcoin and Ethereum could be facing further downside after suffering a significant dip earlier today.
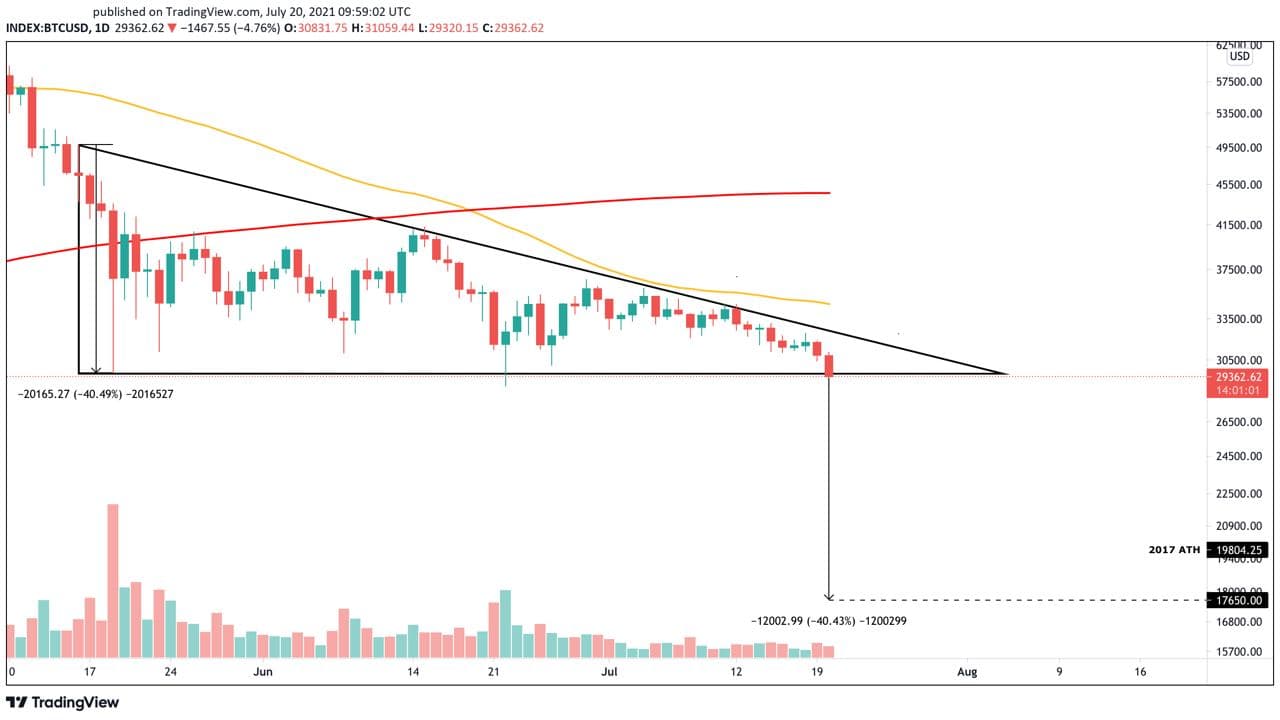
The top-ranked cryptocurrency has endured a two-month-long consolidation period after the 54% decline it experienced between mid-April and May. While its price has made a series of lower highs since then, the $29,600 support level has managed to prevent Bitcoin from a steeper correction.
Such price behavior appears to have formed a descending triangle on BTC’s one-day chart. A horizontal line can be drawn along with the swing lows, while a descending trendline developed along with the swing highs.
A spike in selling pressure for Bitcoin has pushed it below the $30,000 mark to retest the triangle’s X-axis. Now, Bitcoin appears to be at risk of a 40% price crash to $17,650 if the $29,600 support level fails to hold.
This target is determined by measuring the distance between the two highest points of the triangle and adding it to the breakout point.

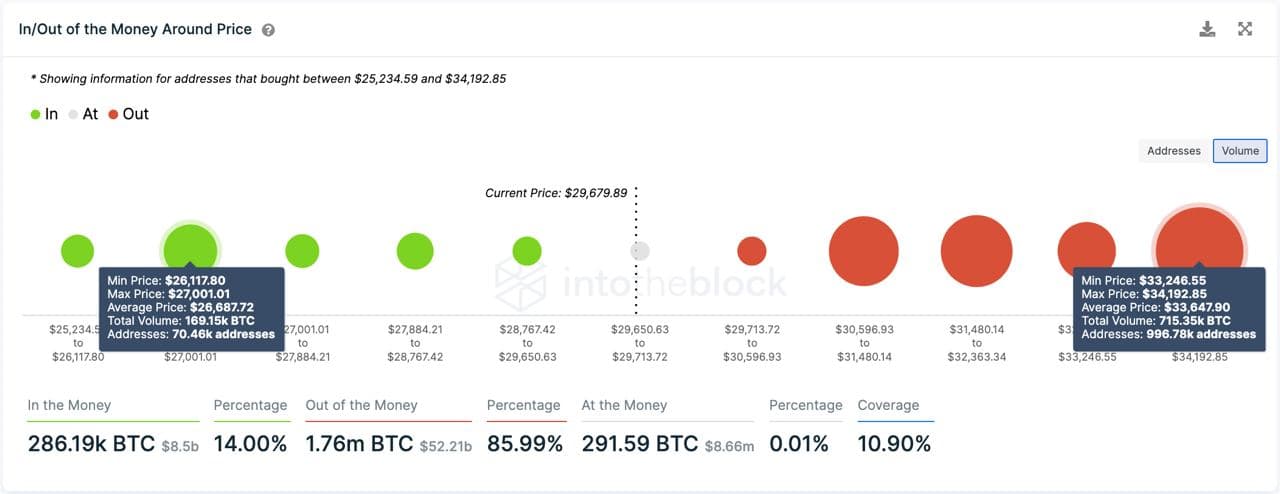
At this level, approximately 75,000 addresses have purchased nearly 170,000 BTC. This is the only significant demand barrier that could absorb some of the recent selling pressure.

Given the strength of this resistance wall, only a daily candlestick close above the price level could prevent Bitcoin from continuing its descent toward $17,650.
Ethereum Finds Strong Foothold
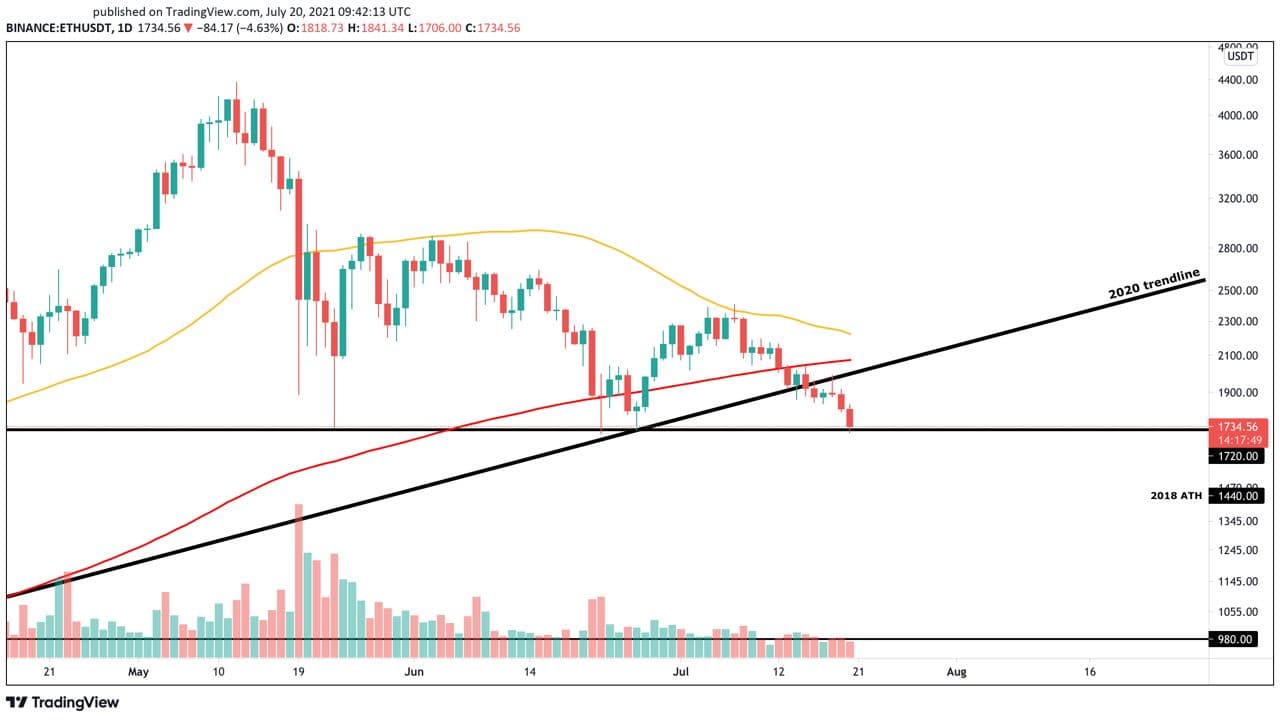
Ethereum has been in a downward trend since it reached a new all-time high of $4,370 in mid-May. The smart contract platform has plummeted by more than 60% to hit a low of $1,700 on Jun. 22. Although prices have recovered over the past month, a rejection from the 50-day moving average on Jul. 7 has spelled trouble for ETH.
Failing to claim the 50-day moving average as support pushed the asset below several vital areas of support. These include a rising trendline that formed following the “Black Thursday” crash of March 2020 and the 200-day moving average.
Now, ETH appears to have found a strong foothold around $1,700.

Such a massive demand barrier could absorb any further downward pressure, as holders who bought in that range may want to prevent their investments going “Out of the Money.” It’s possible that they could buy more tokens to help prices rebound.
If buy orders pick up at this crucial demand wall, Ethereum could have an opportunity to rebound toward $2,000 as the IOMAP shows no critical supply barriers in-between.
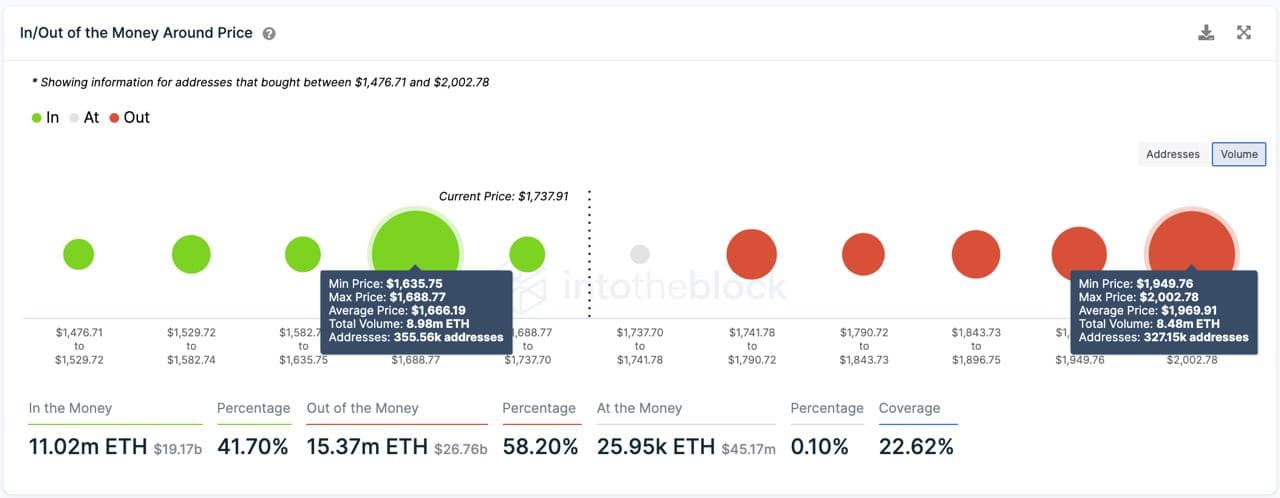
IntoTheBlock’s IOMAP adds credence to the importance of the $1,700 level for Ethereum’s uptrend. Based on this on-chain metric, over 355,000 addresses have previously purchased nearly 9 million ETH around this price point.
Such a massive demand barrier could absorb any further downward pressure, as holders who bought in that range may want to prevent their investments going “Out of the Money.” It’s possible that they could buy more tokens to help prices rebound.
If buy orders pick up at this crucial demand wall, Ethereum could have an opportunity to rebound toward $2,000 as the IOMAP shows no critical supply barriers in-between.


