Key Takeaways
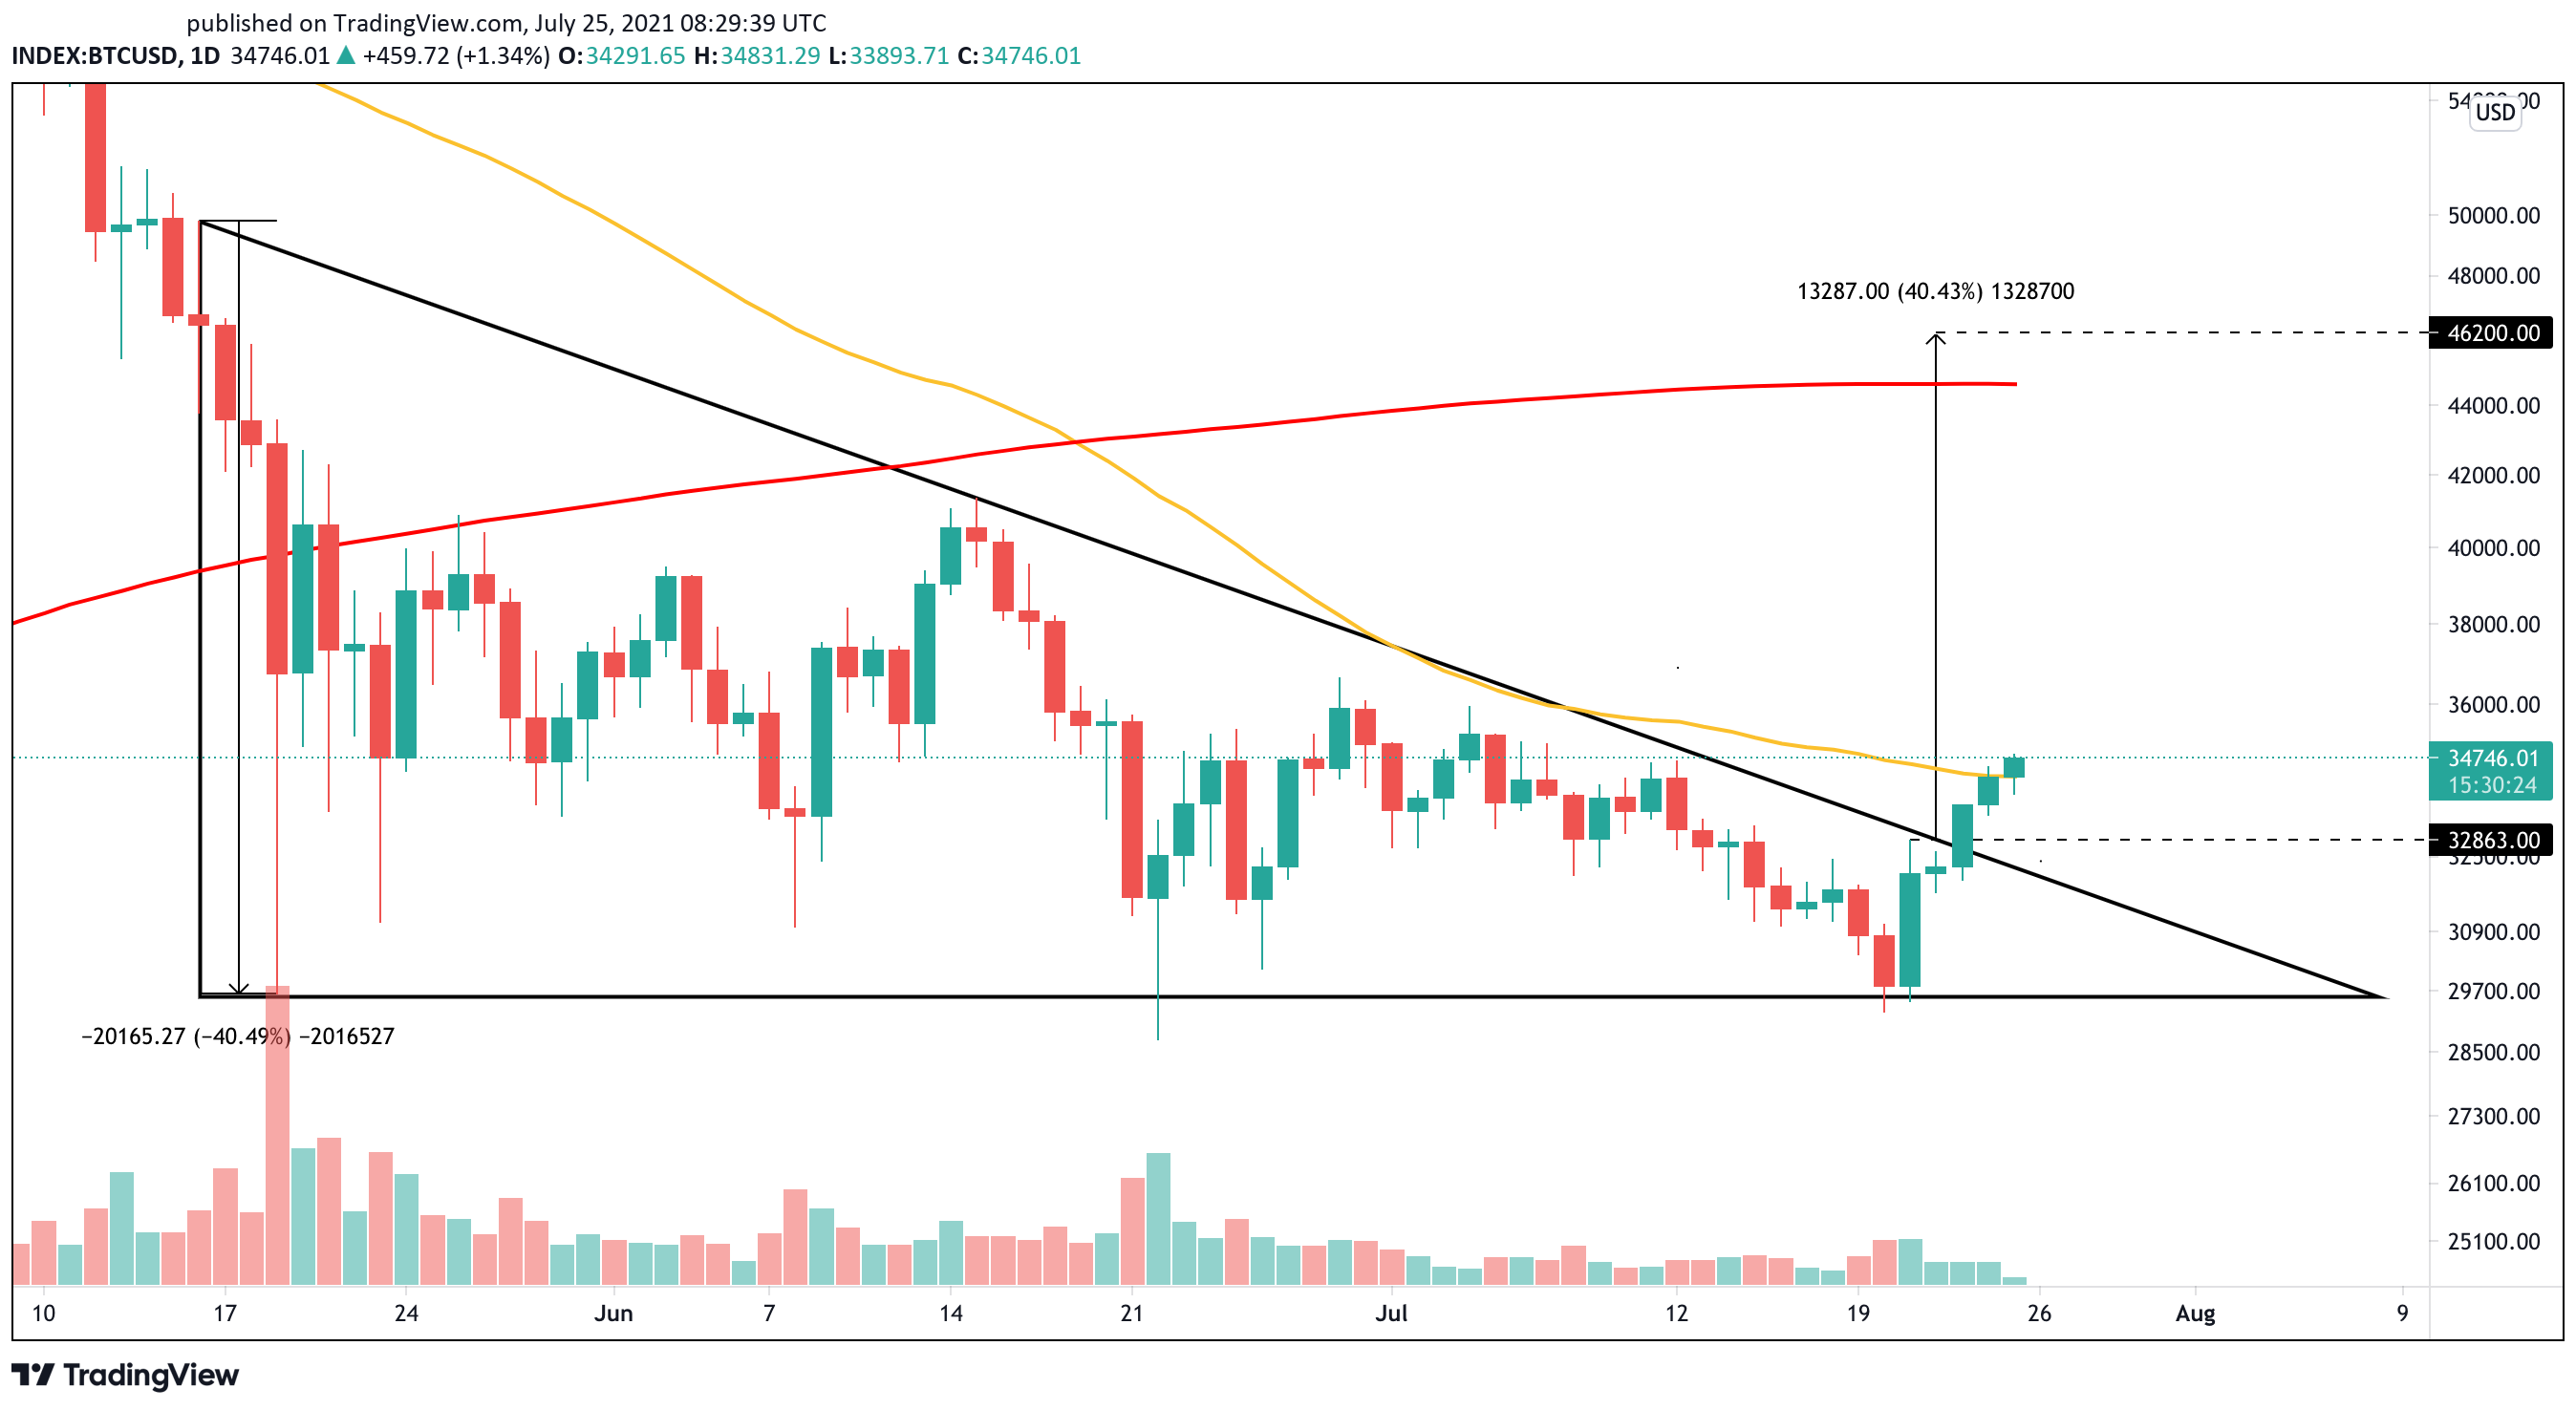
- Bitcoin seems to have broken out of a descending triangle pattern on its daily chart.
- A spike in buying pressure could see prices rise by more than 40% towards $46,200.
- Bitcoin must hold above the $32,700 demand barrier for the bullish outlook to remain intact.
Bitcoin has turned a crucial resistance level into support, which may attract enough buyers to push prices higher.
Bitcoin Begins New Uptrend
Bitcoin is looking bullish.
The largest cryptocurrency by market capitalization seems primed for high volatility after enduring a two-month-long consolidation period. The recent breach of a descending triangle’s hypotenuse that had been forming on BTC’s daily chart since May 16 could be the catalyst for a new bull run.
The height of the triangle’s y-axis added to the breakout point suggests that Bitcoin could surge by more than 40%. If buy orders continue to pile up, the leading cryptocurrency would likely head towards the 200-day moving average at $45,000 and potentially move past it to hit a target of $46,200.
Now that the 50-day moving average at $34,200 has been turned into support, Bitcoin would have to stay above it and the triangle’s hypotenuse at $32,860 to support the bullish thesis.

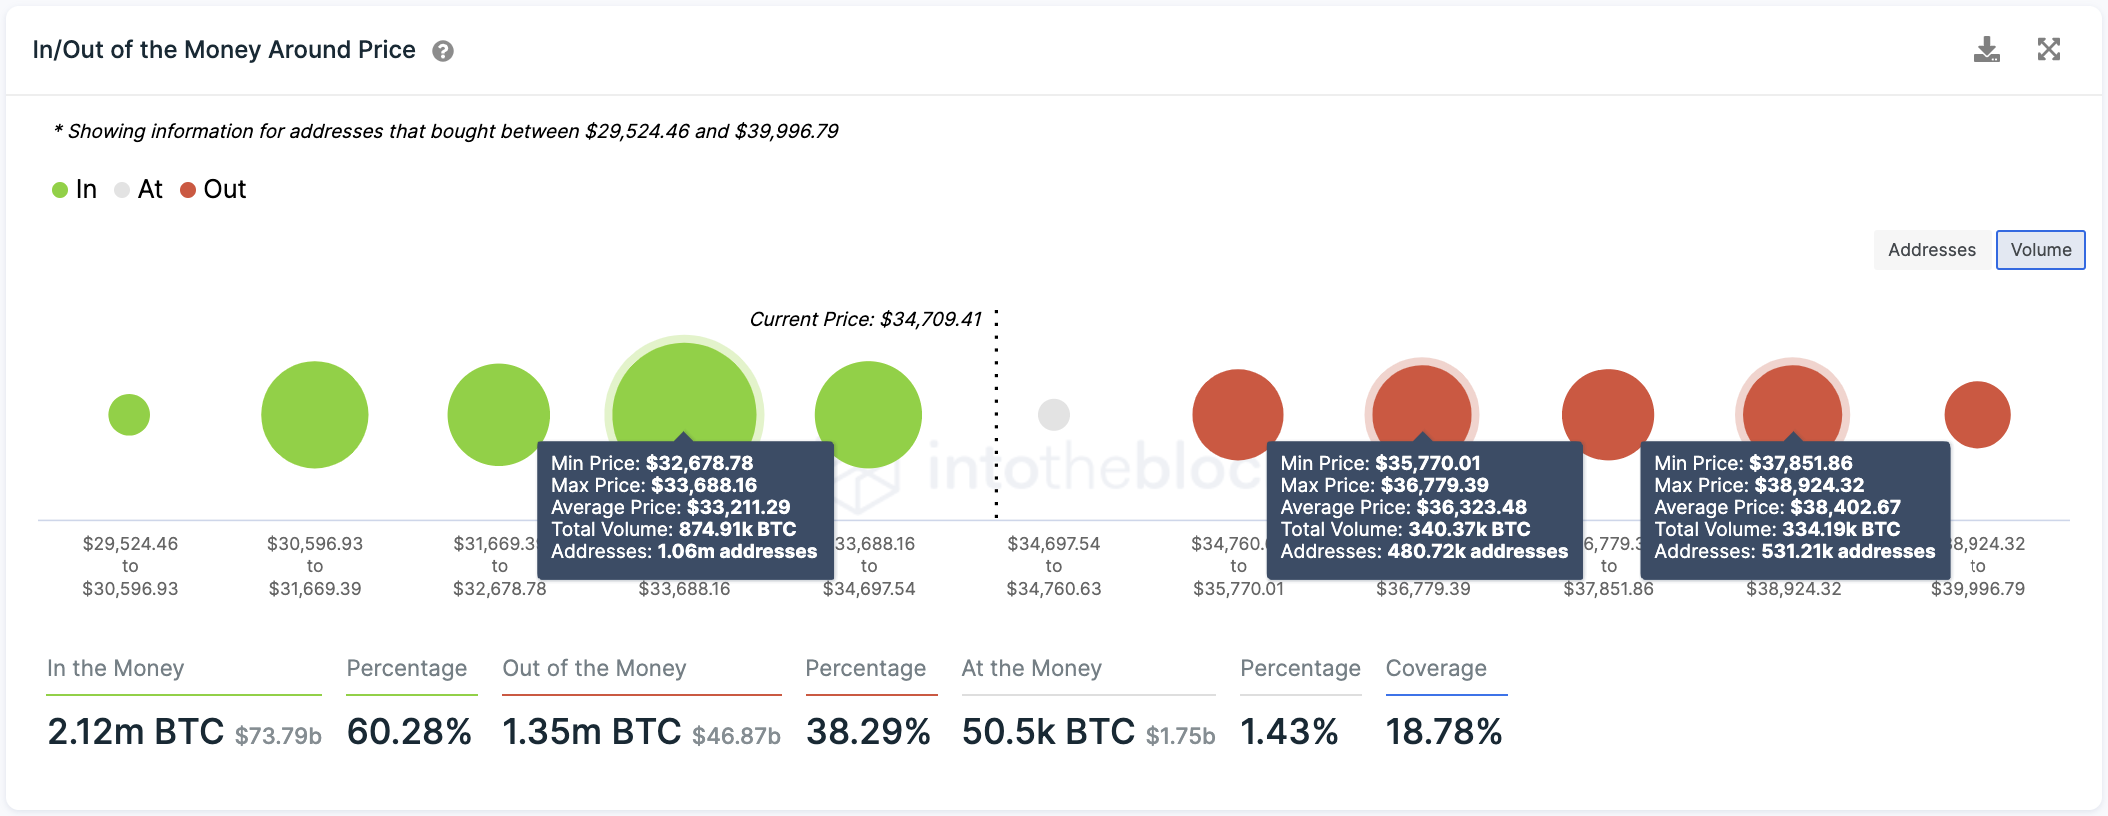
Based on IntoTheBlock’s In/Out of the Money Around Price (IOMAP) model, more than 1 million addresses had previously purchased nearly 875,000 BTC around this price level. These Bitcoin holders would likely aim to prevent seeing their positions go “Out of the Money.” Some may buy more BTC in the event of a downswing, allowing prices to rebound.
Therefore, only a daily candlestick close below the $32,700-$33,700 range could invalidate the optimistic outlook.

Although these resistance levels could prove hard to break if the buying pressure behind Bitcoin fails to pick up, they won’t necessarily pose a threat to the bullish scenario.


