 Image Source: Pixabay
After the September to forget, October was another weak month for markets, with several factors driving losses across different asset classes. In particular, as DB’s Henry Allen notes, the attack by Hamas on Israel on October 7 led to significant concerns about geopolitical risk, and investors remained cautious given concerns about a wider escalation.Alongside that, October saw another strong round of US economic data, which helped drive a fresh rise in long-dated borrowing costs and added to fears about the impact of higher rates on the broader economy. That meant the S&P 500 lost ground for a 3rd consecutive month for the first time since the pandemic turmoil of March 2020, whilst US Treasuries lost ground for a 6th consecutive month.So what happened in October? First, the highlights courtesy of DB’s Jim Reid:
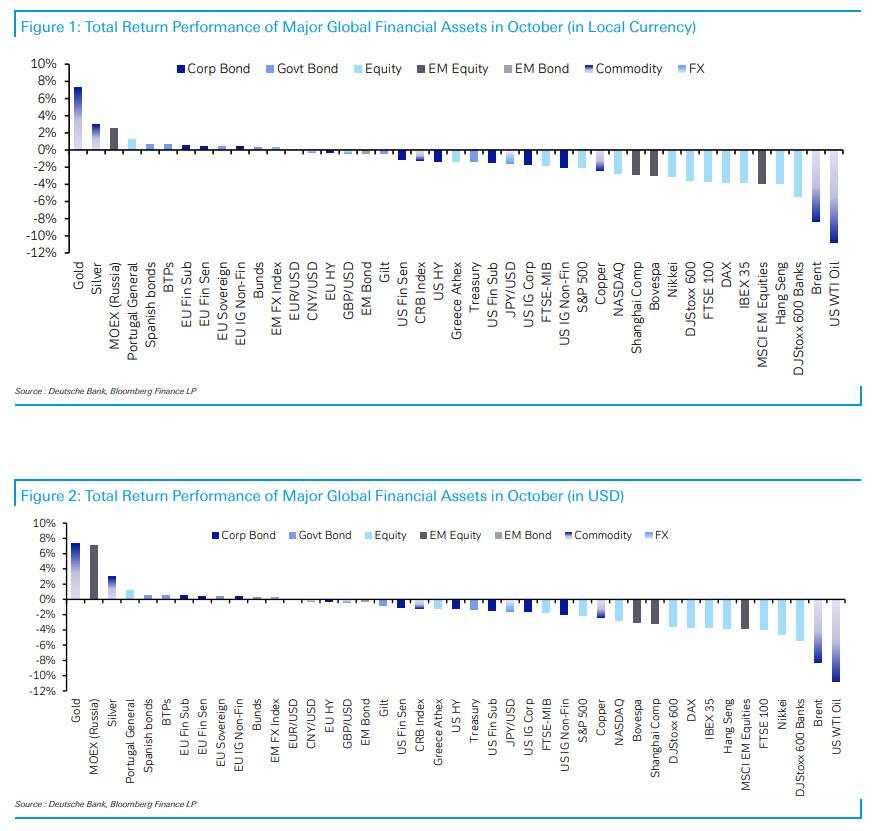
And here is some more detailed macro commentary courtesy of DB’s Henry AllenThe biggest global story in October was the attack by Hamas on Israel on October 7. From a market perspective, the biggest concern was whether this might lead to a broader escalation, and there was a clear reaction among several important assets. For instance, oil prices rose by +7.5% in the week immediately following the October 7 attack, marking the biggest weekly rise since February. There has also been a significant +7.3% rise in gold prices over October thanks to safe haven demand, which is the strongest month for gold since the banking turmoil in March. Israeli assets themselves have also seen significant losses in response. For instance in equities, the TA-35 index is down -10.7%, marking its worst monthly performance since March 2020. Meanwhile in FX, the Israeli shekel has weakened -5.6% against the US Dollar.Elsewhere in markets, the other main story has been the continued resilience of the US economy, with recent data continuing to surprise on the upside for the most part. At the start of the month, the jobs report on October 6 showed that +336k jobs were added in September, which was the most since January. Alongside that, the latest data also showed ongoing inflationary pressures, with core CPI coming in at a 5-month high in September of +0.32%. With that in mind, futures continued to price in a chance that the Fed might deliver another rate hike, with a 41.5% chance of a hike still priced in by the January 2024 meeting.That ongoing data resilience meant that US Treasuries continued to lose ground in October. For instance, the 10yr yield rose for a 6th consecutive month to close at 4.93%, and it even briefly surpassed the 5% mark at one point for the first time since 2007. Furthermore, there are several signs that this rise in longer-term borrowing costs has been filtering through to the real economy, with data from the Mortgage Bankers Association showing that the average rate on a 30yr fixed mortgage is now up to 7.9% in the week ending October 20, which is the highest since 2000.With rates continuing to rise, we also saw fresh losses for equities in October, and the S&P 500 was down -2.1% in total return terms. That’s the 3rd consecutive monthly decline for the S&P 500, which is the first time we’ve seen 3 consecutive declines since March 2020. For reference, the only time since the GFC we’ve seen a run of more than 3 monthly declines for the S&P was in mid-2011, when the index lost ground for 5 consecutive months amidst the Euro Crisis and the US debt ceiling crisis.The other major global equity indices saw losses in October as well, including the Nikkei (-3.1%), which saw a 4th consecutive monthly decline for the first time since 2013. Whilst the US data was resilient, the European data was much weaker in October. For instance on the last day of the month, the first estimate of Q3 GDP for the Euro Area showed a -0.1% contraction. As it stands on current revisions, that marks the weakest quarterly performance for the Euro Area economy since Q2 2020. That said, there was some better news on the inflation side, with the flash CPI release for the Euro Area in October falling to a two-year low of +2.9%. In turn, that helped Euro Area sovereign bonds to outperform, with a +0.4% gain over the month. Finally, we also saw a 3rd consecutive monthly rise in European natural gas prices, which ended the month up +14.7% at €48.01/MWh.Which assets saw the biggest gains in October?
Which assets saw the biggest losses in October?
Finally, here is the above in visual format, first the October return of various asset classes in both USD and Local currency terms… 
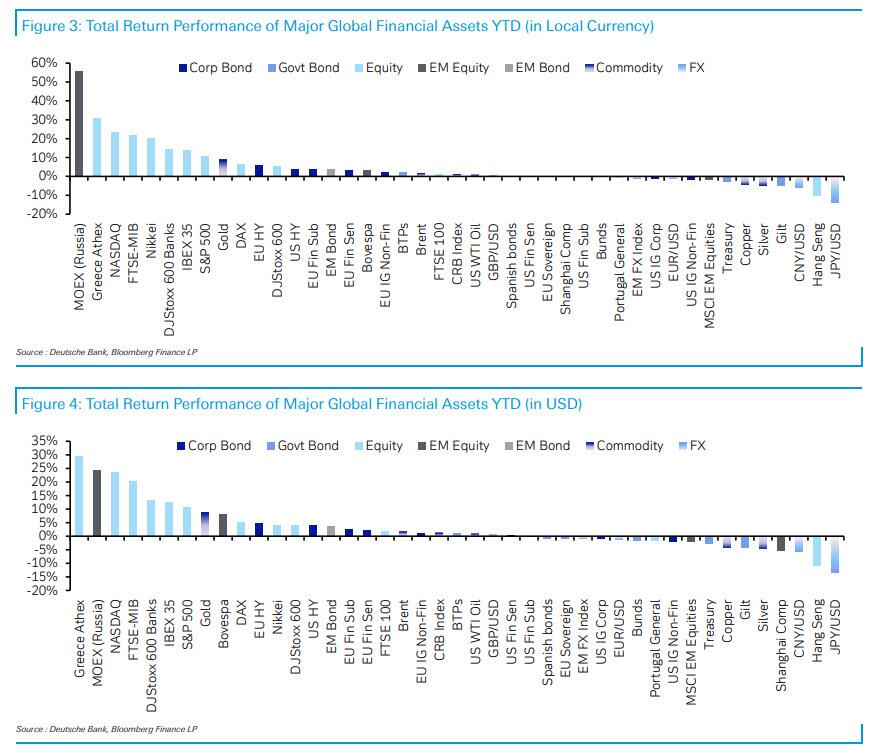
… and here, YTD.  More By This Author:Fed Remains ‘Paused’, Acknowledges Tightening Financial Conditions ‘Doing Its Job’WTI Holds Gains After Small Crude Build, Cushing Just Off ‘Tank Bottoms’FBI Director Warns Threat Of Attacks By Hamas On American Soil Raised “To A Whole Other Level”


