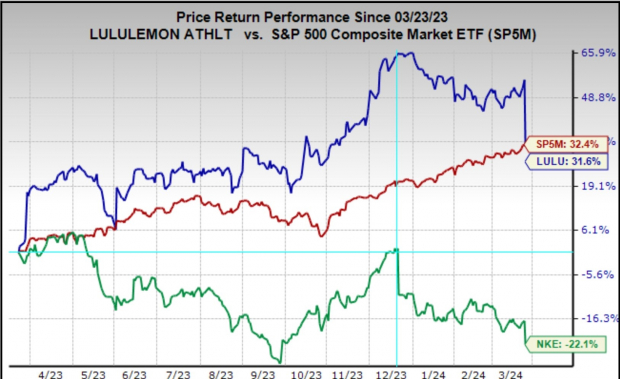

We are still a couple of weeks away from the March-quarter reporting cycle really getting underway with the big-bank results. But early results in recent days from companies for their February-ending fiscal quarters have given us some idea of what this coming earnings season will show.To that end, we tried to get some sense of the coming Tech sector results by looking at the Oracle and Adobe quarterly reports last week. This week, we want to focus on the consumer space by looking at the recent Nike (NKE – Free Report) and Lululemon (LULU – Free Report) results.The market’s negative reaction to the Nike and Lululemon reports is a result of weak guidance from both companies.As you can see in the chart below, which shows the one-year performance of the two stocks relative to the S&P 500 index, Nike has been dealing with company-specific issues for some time now. In fact, this is the second quarter in a row of disappointing guidance from the company.  Image Source: Zacks Investment Research
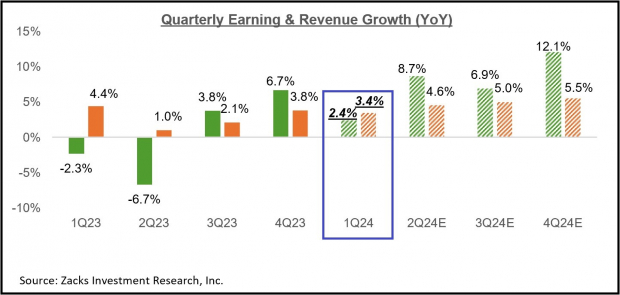
Lululemon shares had been drifting ‘sideways-to-lower’ over the last few months, but the stock has otherwise been a big winner in recent years. Lulu’s aforementioned outperformance has not been without its share of detractors, with this negative surprise strengthening the naysayers’ conviction. The bearish argument is for shifting consumer preferences in the company’s core North American market, which still accounts for almost 80% of its total revenues. The bears acknowledge the company’s favorable international momentum but see a slowdown in the core home market as a far more significant headwind going forward.In a way, the Nike and Lululemon reports don’t tell us much about the health of the consumer economy, which has long been seen as vulnerable due to cyclical and macroeconomic factors but continues to chug along.That said, discretionary spending appears to be going more towards ‘experiential’ categories, like leisure and entertainment, instead of the type of ‘goods’ that Nike and Lululemon offer. It is reasonable to expect some moderation in consumer spending as well, which will be a net negative for consumer-facing operators like Lulu and Nike.The Nike report and this week’s reports from Carnival (CCL – Free Report), Walgreens (WBA – Free Report), and others are for their respective fiscal quarters ending in February, which we and other research organizations count as part of the overall March-quarter or Q1 tally. In fact, by the time the big banks come out with their quarterly results on April 12th, we will have such Q1 results from almost two dozen S&P 500 members. Through Friday, March 22nd, we have seen such February-quarter results from 13 S&P 500 members.Regular readers of our earnings commentary are familiar with our sanguine view of the overall earnings picture. We aren’t saying that the earnings picture is great, but we don’t agree with the doom-and-gloom projections either.Earnings growth remained under pressure in 2022 and through the first half of 2023 as a host of macro factors weighed on corporate profits. These factors included the post-COVID onset of inflationary pressures that compressed margins while the Fed’s extraordinary tightening moderated top-line growth.A loud segment of the commentariat saw these unfavorable trends culminating in an economic recession and a material hit to the overall earnings picture. However, the U.S. economy has proved resilient, and the Fed’s extraordinary tightening has put us on track for a happy resolution to the inflation issue.With the Fed now gearing up to start easing policy in the coming months, those extreme risks to the economy and corporate earnings have eased significantly. This is the macro backdrop in which we will receive the Q1 earnings results in the coming days.The expectation is that Q1 earnings will be up +2.4% from the same period last year on +3.4% higher revenues, which would follow the +6.7% earnings growth on +3.8% revenue gains in the preceding period.The chart below shows current earnings and revenue growth expectations for 2024 Q1 in the context of where growth has been over the preceding four quarters and what is currently expected for the following three quarters. Image Source: Zacks Investment Research
As we have noted here all along, estimates for Q1 came down as the quarter got underway, though the magnitude of cuts to Q1 estimates compared favorably to what we had seen in the comparable period to the preceding quarter.While Q1 estimates came down in the aggregate, the bulk of the negative revisions were concentrated in the Energy, Autos, Basic Materials, and Transportation sectors. On the flip side, estimates modestly increased for the Retail, Consumer Discretionary, and Tech sectors, enjoying notable positive revisions.Embedded in current Q1 earnings and revenue estimates is a modest year-over-year decline in net margins, as the chart below shows. Image Source: Zacks Investment Research
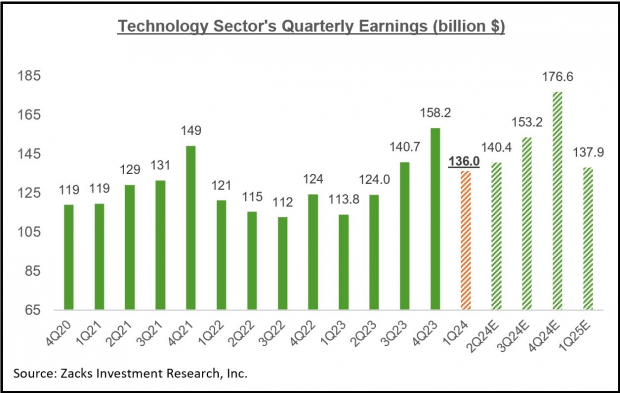
This chart shows that the extreme margin pressure that we witnessed in 2022 and the first half of 2023 is now behind us.For 2024 Q1, net margins are expected to be below the year-earlier level for 9 of the 16 Zacks sectors, with the biggest declines in the Energy, Basic Materials, Autos, and Medical sectors. Net margins are expected to be above the year-earlier level for 5 of the 16 Zacks sectors, with the biggest gains at the Tech and Utilities sectors.The Tech sector is now firmly back in growth mode, and this trend is expected to continue.For 2024 Q1, Tech sector earnings are expected to increase +19.5% from the same period last year on +7.9% higher revenues. This would follow the sector’s +27.4% higher earnings in 2023 Q4 on +8.5% higher revenues.The sector experienced a period of post-COVID adjustment in 2022 and the first half of 2023, during which time it became a drag on the aggregate growth picture.Please keep in mind that Tech isn’t just any other sector — it is the biggest earnings contributor to the S&P 500 index. The sector is currently expected to bring in 28.9% of the index’s total earnings over the coming four-quarter period, with the second and third biggest contributors in Finance and Medical at 17.8% and 12.5%, respectively.This means that the Tech sector’s growth profile has a very big impact on the aggregate picture, both negatively and positively.The Tech sector dragged down the aggregate growth picture in 2022 and the first half of 2023 but now appears ready to resume its historical positive growth role.You can see this growth profile in the chart below, which also shows that the sector’s 2023 Q4 earnings tally of $158.2 billion was a new all-time quarterly record. Image Source: Zacks Investment Research
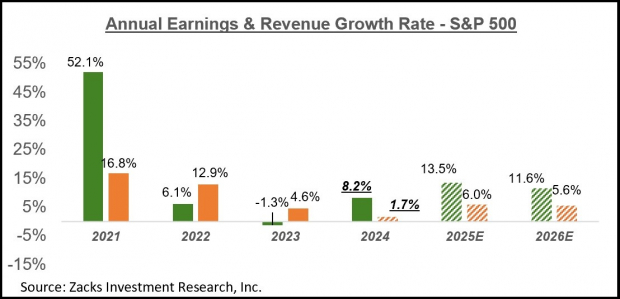
Please note that the Tech sector is instrumental in keeping the aggregate growth picture in positive territory in Q1. Excluding the sector’s substantial contribution, Q1 earnings for the rest of the index would be down -3.2% from the same period last year (vs. +2.4% as a whole).Looking at the overall earnings picture on an annual basis, total 2024 S&P 500 earnings are expected to be up +8.2% on +1.7% revenue growth. Image Source: Zacks Investment Research
2024 Q1 Earnings Season Scorecard
As noted earlier, we now have February-quarter results from 13 S&P 500 members, with another 5 index members on deck to report results this week. These February-quarter results get clubbed as part of the overall March-quarter tally. As such, we see these fiscal February-quarter results as the initial 2024 Q1 results.Total Q1 earnings for these 13 index members are up +43.3% from the same period last year on +4% higher revenues, with 76.9% beating EPS estimates and 46.2% beating revenue estimates.This is too early to draw any firm conclusions, but we nevertheless compare the earnings and revenue growth rates for these 13 index members to other recent periods. Image Source: Zacks Investment Research
The comparison charts below put the Q1 EPS and revenue beats percentages in a historical context. Image Source: Zacks Investment ResearchMore By This Author:2024 Q1 Earnings Loom: What Can Investors Expect?
Tech Sector Resumes Growth Mode
Top Analyst Reports For Exxon Mobil, PepsiCo & HSBC


