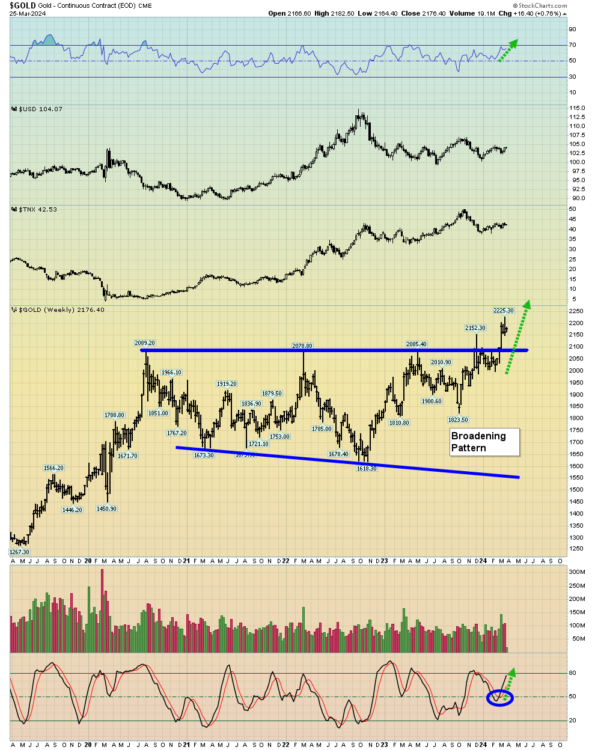
More mainstream analysts are “tuning in” to gold by the day. They are noting the incredible resiliency of this mightiest of metals during the recent rate hiking frenzy.Is China “taking over” gold price discovery and if so… is the price headed significantly higher?Well, the commercial COMEX and LBA traders in the West have always keyed off physical demand in the East, so nothing has changed in that regard.What is changing is… size. The size of the Eastern gold market is growing and it’s the reason there’s less (but still significant) volatility in the price action. The population of the East dwarfs that of the fiat-obsessed West.This growth of the Eastern gold market will continue for decades to come (and likely for another 200 years). It’s important for gold bugs in the West to invest like their Eastern brethren do… by focusing their buys on price sales of significance. The bottom line:There’s a time to cheer and a time to buy. Now is a time to cheer, and to do that with gusto: 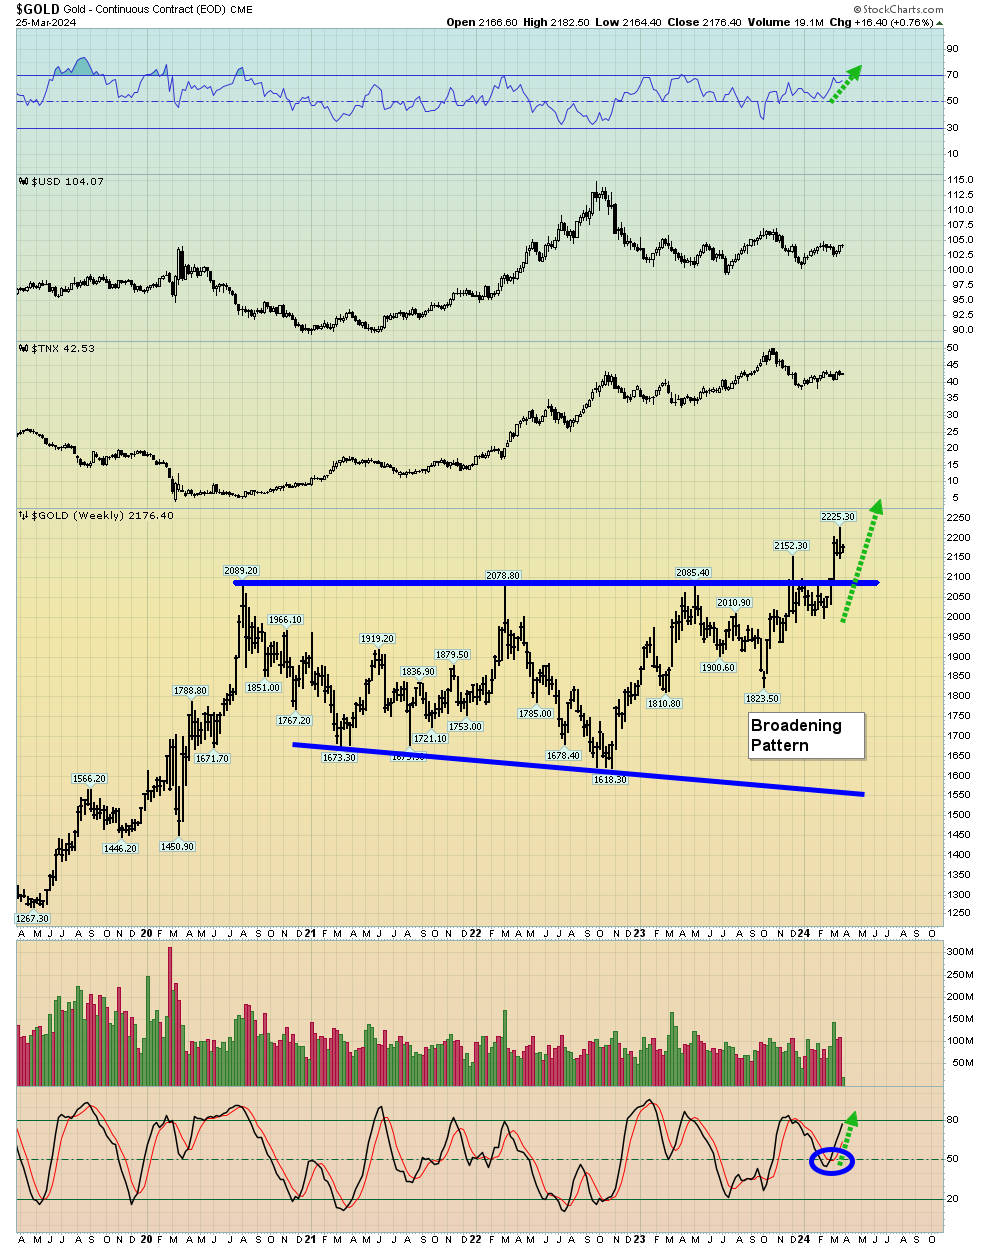 spectacular weekly gold chart. A broadening formation breakout is clearly in play.At some point a pullback to the breakout zone (about $2100) is likely, but it appears to be months away from happening.
 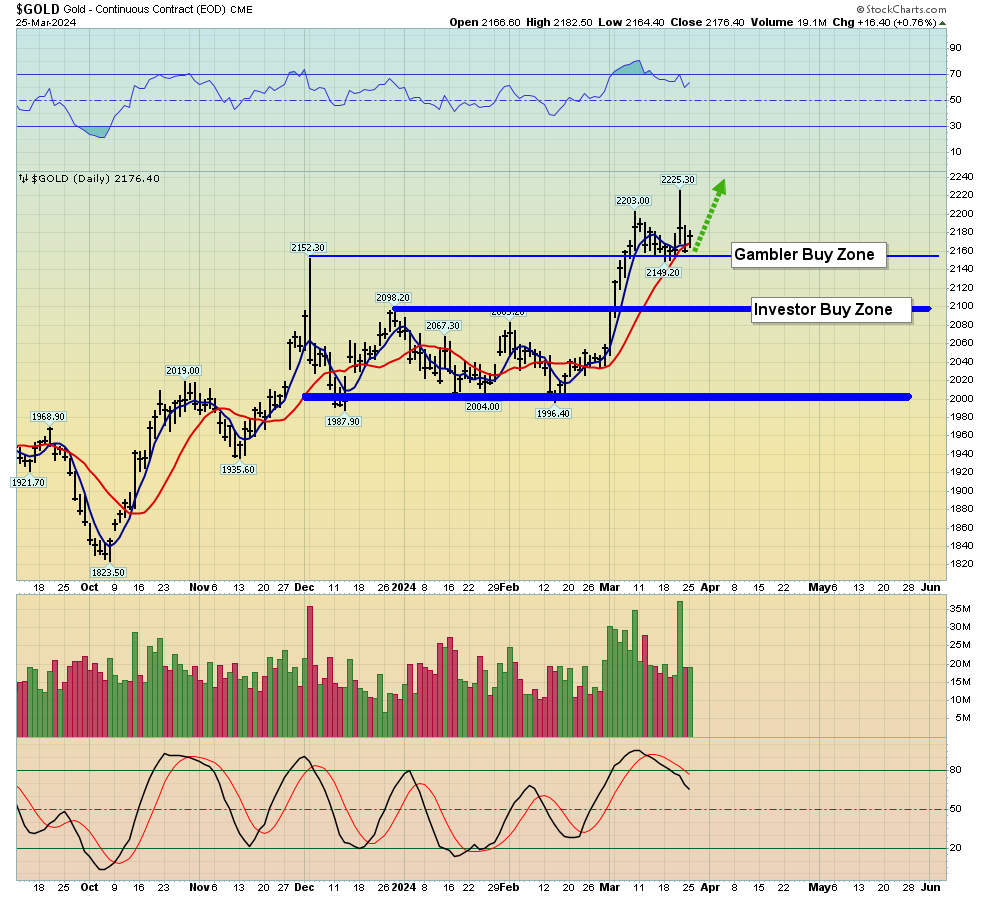 On this daily chart, gold is finding great support at the previous $2152 high, and I urged gamblers to buy as the price went there.More patience is required for investors… especially those who have large gold, silver, and mining stock holdings.Indian market premiums have gone to a discount, and the COMEX smart money commercial traders tend to cue off that market. India’s gold-obsessed citizens are enjoying the gold market rally more than anyone, since they have the most gold…But they won’t buy much more gold until there’s a pullback of significance. For now, it’s likely that the gold market rally against hideous US fiat will intensify and there won’t be major sell-off until the summer.What about the 2021-2025 war cycle… is it a factor in the current price action? I’ll suggest that it is, and on that note:
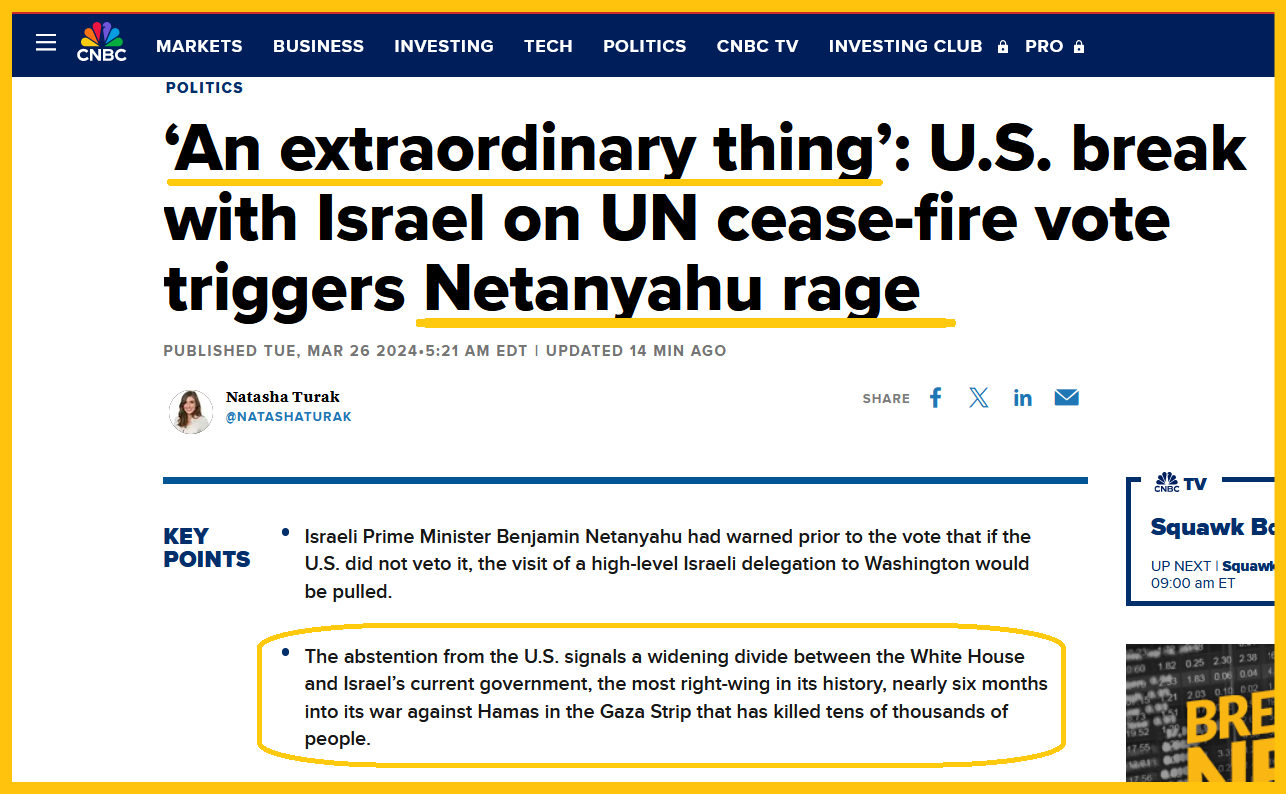 Biblical cycle enthusiasts may want to note that in the “End Times”, Israel as a nation stands alone against the rest of the world.On the other side of the coin, some analysts believe that the Israeli “Nman” (Netanyahu) is best described as “Patton on Crack”, due to him lording over an utterly outrageous ratio of dead and mangled Gaza innocents versus dead and mangled Hamas terrorists. He relishes the mayhem to date… and appears eager for more.Regardless, what is clear is that US government and Israeli government friction is intensifying and doing so in a major way. This friction is likely here to stay for a long time… and it’s probably going to produce another $100/oz of support (higher price) for gold!Chindian gold bugs love their gold jewellery and Western gold bugs love their mines. High carat gold jewellery has tracked the price of gold magnificently (minus a 15% making charge).For many years, the miners haven’t done such a good job of tracking gold, let alone outperforming it for any length of time… but that may be about to change.
 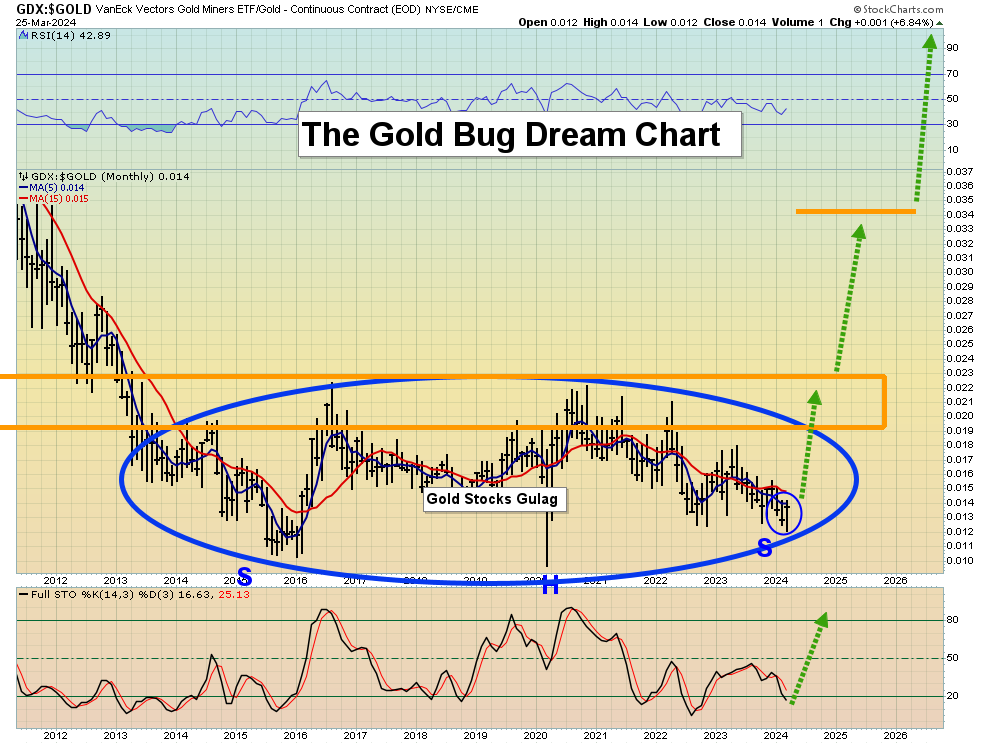 stunning GDX versus gold monthly chart. A massive ten-year inverse H&S pattern is in play.The great news is that a monthly key reversal bar is in play. It could mark the right shoulder low. Also, note the fabulous position of the Stochastics oscillator (14,3,3 series). Its posture suggests a mining stock “rally of significance” is imminent.
 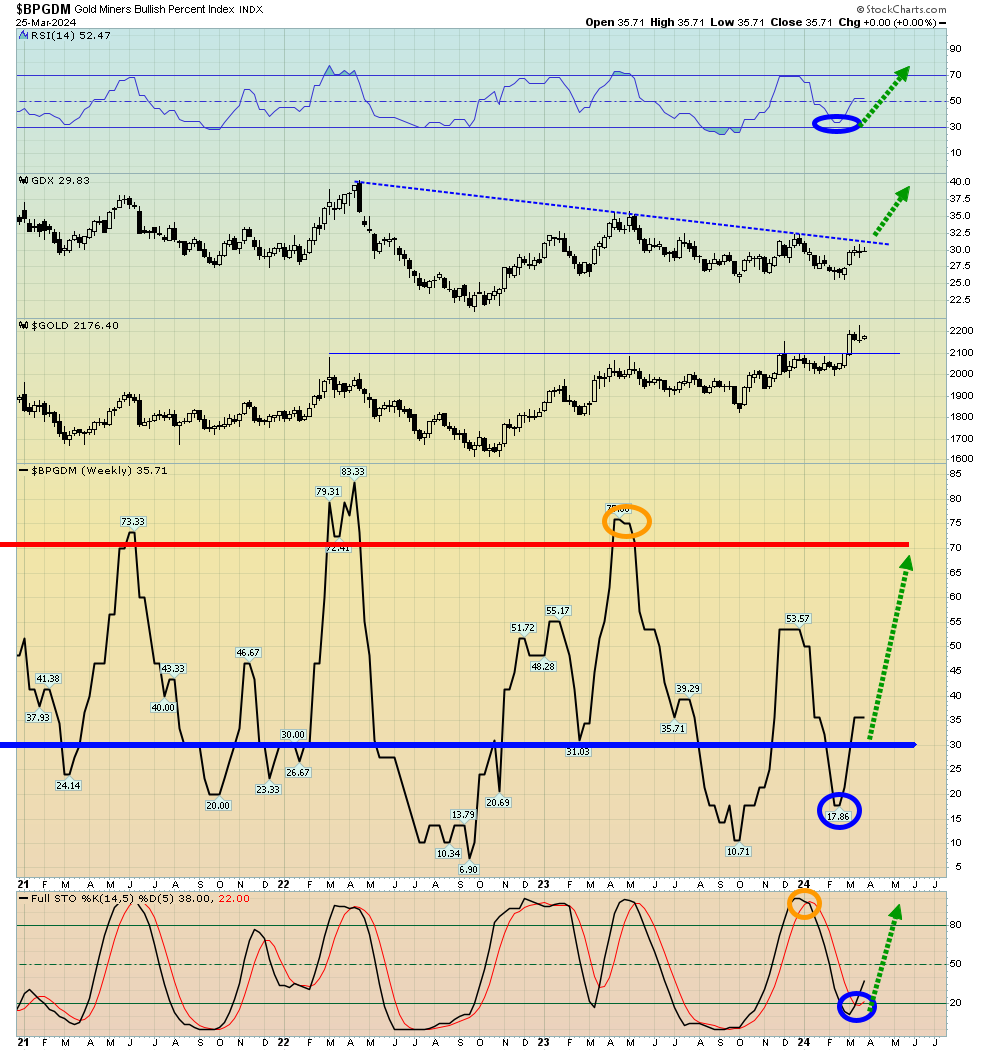 weekly BPGDM gold stock sentiment chart. Both the index and the key 14,5,5 series Stochastics oscillator suggest the miners are set for a spring and early summer surge.
 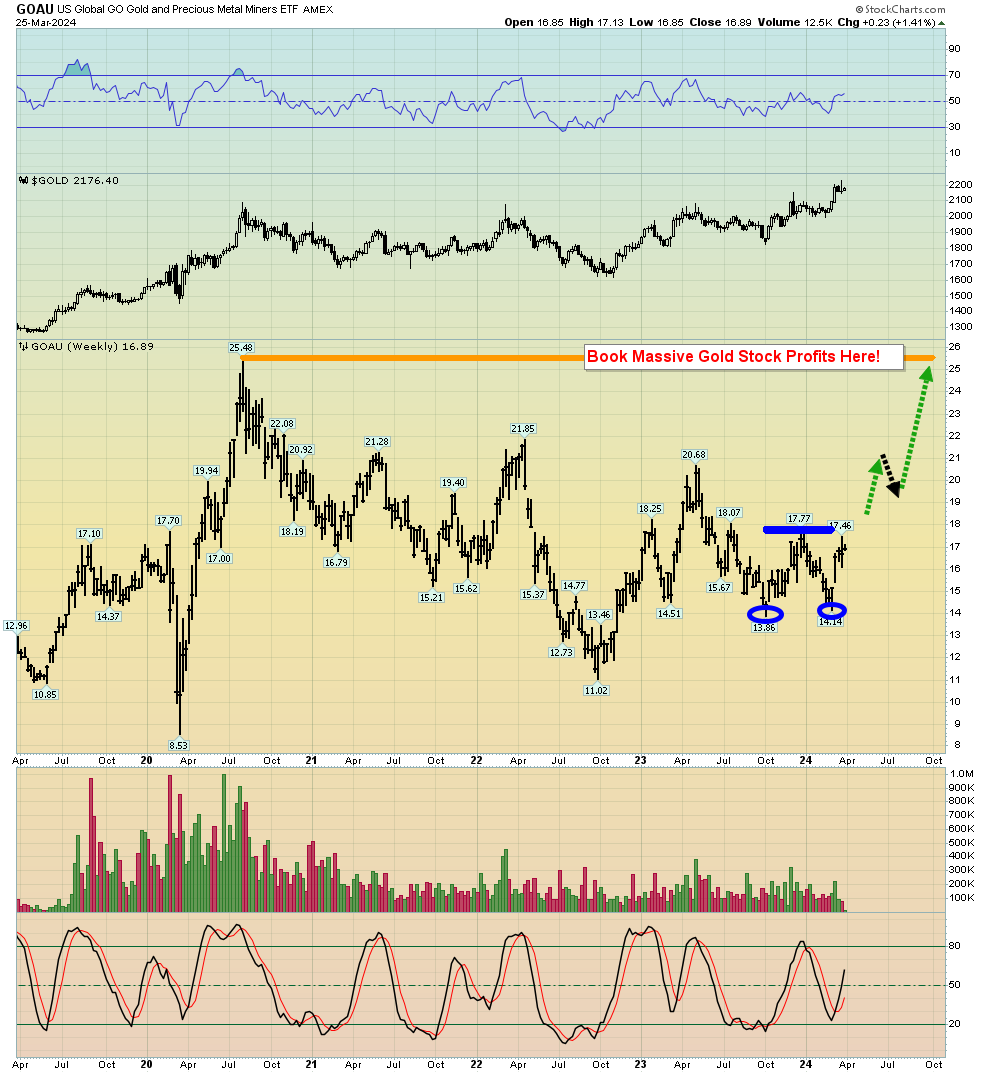 Basis the weekly GOAU chart, a Friday close over $18 is the catalyst for the launch of the next (and stronger) stage of this rally. A surge to my “high in the sky” target zone of $25 is the most likely scenario… once the Friday close over $18 occurs!More By This Author:Yen & USD: Wet Noodles Vs. GoldJulius Stock Market Caesar And GoldThe Frenzy Begins


