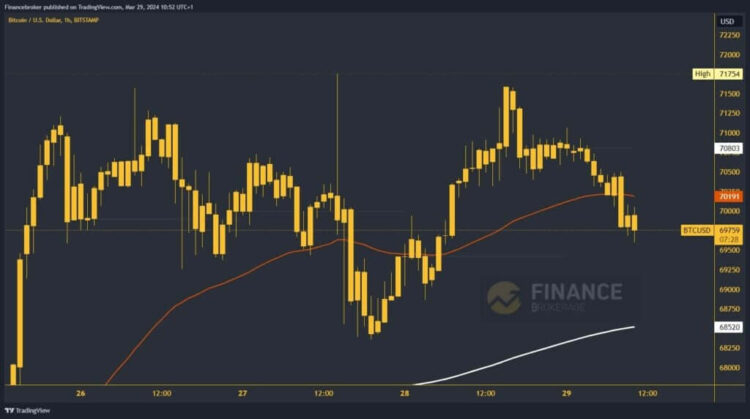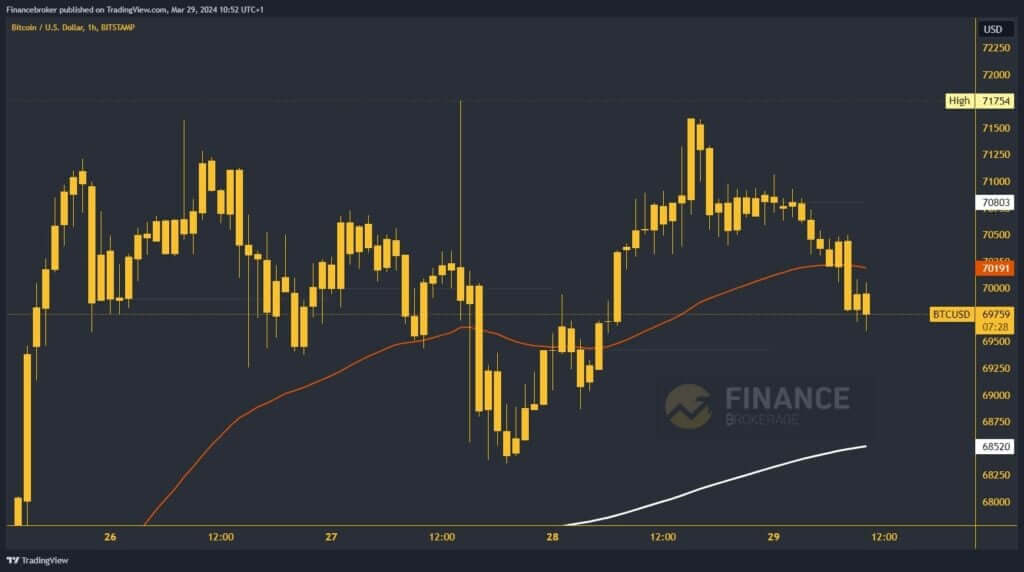
Bitcoin chart analysisThe price of Bitcoin rose to $71,587 on Thursday. We failed to move above the $72000 level again. A new bearish consolidation and pullback below $71000 was initiated from the new resistance. This morning, we also broke below that support and continued below $70500.In the zone around $70200, we come across the EMA50 moving average, which failed to keep us above, or a breakthrough followed and a fall below the $7000 level. The price of Bitcoin is now at the $69690 level, and the current bearish momentum tells us that we could go even lower. Potential lower targets are $69500 and $69000 levels. The EMA200 moving average is even lower at the $68500 level.  Will we see further Bitcoin pullback or will we get support?We would have to move back above the EMA50 moving average and the $70200 level for a bullish option. If we succeed in that, the next step is to stay above. After that, we are waiting for a bullish consolidation and the start of Bitcoin’s recovery. With the return to $70,800, we are going to test the daily open price.The new momentum above takes us back into positive territory and increases optimism that we could see Bitcoin again in the previous bullish rally. Our eyes are then fixed on yesterday’s high at the $71600 level. A breakthrough that resistance pushes us to $72,000, and above that, it’s only a matter of time before we climb to a new all-time high.More By This Author:BoJ’s Tone: A Slow, Optimistic Influence On USD/JPYRipple And Tron: Ripple Under Less Pressure At 0.6250 Level Dogecoin And Shiba Inu: Shiba Inu On The Bullish Side


