
Yield Curve Could Be Signaling a Big Stock Market Crash
What stock market crash?To the contrary, key stock indices are currently hovering close to all-time highs, investor sentiment is rosy, and there isn’t much bearishness out there.But investors beware: there’s one stock market crash indicator that’s flashing red.If this indicator’s pattern repeats itself, then don’t be shocked to see market losses mounting to 25% or higher.Dear readers, please pay very close attention to what’s happening with the yield curve.The yield curve is usually considered an economic indicator. Economists and market strategists watch it to see where the interest rates and economy could go.However, it also is a great indicator of the direction of the stock market.Investors need to be extremely cautious whenever the yield curve turns normal after being inverted for a while. Usually around the time when the curve is normalizing, a definitive top forms on the stock market. Then, as the yield curve continues to march into further normal territory, a rigorous stock market crash tends to follow.We have seen this happen twice in recent history.
Yield Curve Predicted Stock Market Crash of 2000–2002
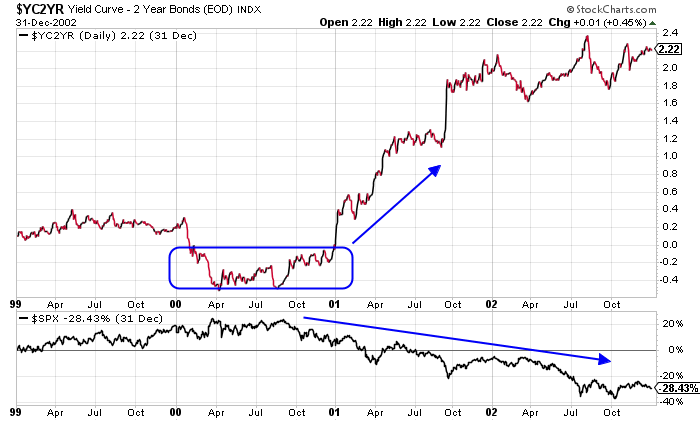
The chart below plots the yield curve and the return on the S&P 500 between 1999 and late 2002.Between 2000 and early 2001, the yield curve became inverted. Then, as the indicator started to steepen, moving towards normal territory, a major top formed on the stock market. Fast forward to a few months later, and the stock market started to sell off.By late 2002, the stock market had shed a significant amount of value. By late 2002, the S&P 500 was trading 28% below where the index was in early 2001. Chart Courtesy of StockCharts.com
Yield Curve Also Predicted Stock Market Crash of 2008–2009
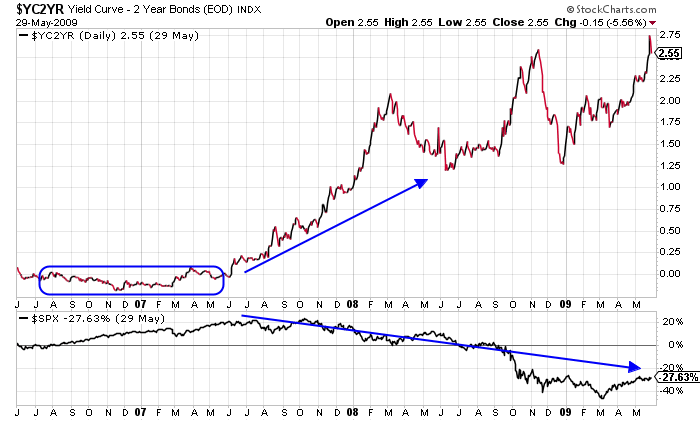
Now look at what happened to the stock market as the yield curve went from being inverted until around mid-2007, when it normalized again.It was like clockwork: the stock market made a top. As the yield curve continued to become normal, a massive stock market crash followed in late 2008 and early 2009.The sell-off was so severe that it wiped out gains made over a period of years in just a matter of months. At one point, the S&P 500 was down roughly 60% from its highs made in 2007! Chart Courtesy of StockCharts.com
The Yield Curve Is Turning…
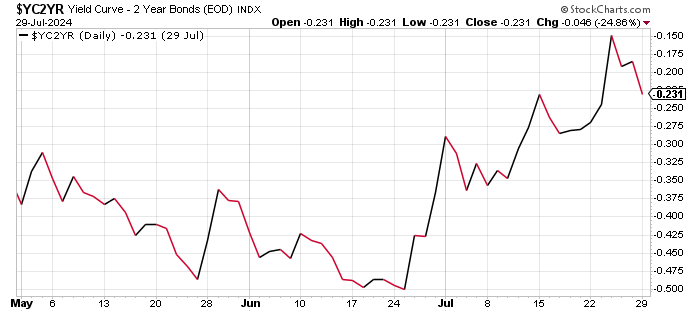
Dear reader, this pattern played out again in 2019, with a subsequent sell-off in 2020. However, it was for such a brief period of time that I don’t think it’s worth more than a passing mention here.Here’s what you do need to know: the yield curve is making strong headway towards normal territory these days. It could be just a few months until it hits this stage.Take a look at the chart below to see how it looks. The yield curve has steepened 27 basis points in about a month. Chart Courtesy of StockCharts.com
Now, one has to ask: could we potentially be seeing a massive top forming on the stock market—and could a crash be around the corner? If not this year, could we see a stock market crash in 2025?Don’t forget, all the stars are aligning perfectly for a stock market crash. We have euphoria among investors, valuations are extremely expensive, and the economy is starting to roll over. I am not surprised that the yield curve is sending warnings signals as well.I will end with what I said earlier: investors beware. Practicing capital preservation and being selective when it comes to picking investment opportunities are beneficial strategies in this kind of environment. Also, having cash on hand may not be a good idea as well. If a stock market crash does occur, investors with cash could be in a position to snatch up some excellent investments at steep discounts.More By This Author:$144.4 Trillion Reasons Why the Odds Of A Financial Crisis Are IncreasingStock Market Crash Ahead? 3 Charts Say Investors Becoming EuphoricGold Prices Outlook: Central Banks Could Send Gold Surging


