
The good news is:
The saying goes “never short a dull market”; perhaps that will apply here.
The NegativesNegatives are in short supply. The PositivesThe first chart covers the last 6 months showing the S&P 5 (SPX) in red and a 10% trend (19 day EMA) of NYSE new highs (NY NH) in green. Dashed vertical lines have been drawn on the 1st trading day of each month. NY NH went nowhere. 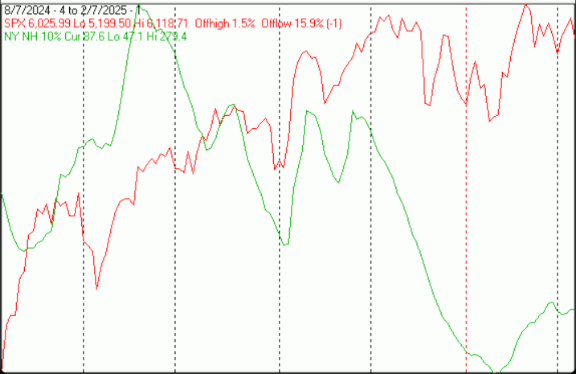 The next chart is similar to the 1st one except it shows the NASDAQ composite (OTC) in blue and OTC NH in green has been calculated with NASDAQ data. OTC NH ditto.
 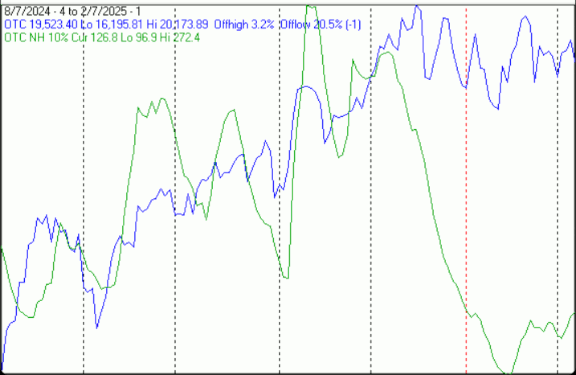 The next chart covers the past 6 months showing the SPX in red and a 40% trend (4 day EMA) of NYSE new highs divided by new highs + new lows (NY HL Ratio), in blue. Dashed horizontal lines have been drawn at 10% levels for the indicator; the line is solid at the 50%, neutral level (equal numbers of new highs and new lows).NY HL ratio declined a little at the beginning of the week; then finished the week modestly positive.
 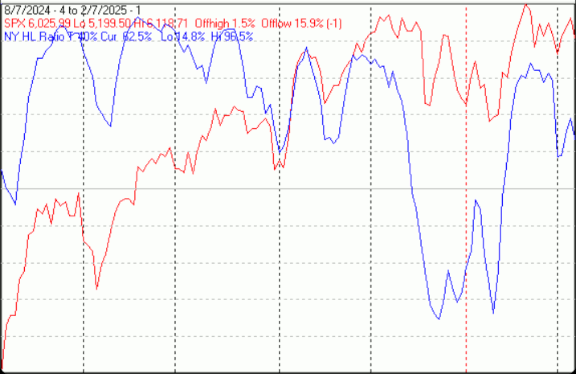 The next chart is similar to the one above except it shows the OTC in blue and OTC HL ratio, in red, has been calculated with NASDAQ data.OTC HL Ratio has a pattern of lower highs and higher lows.
 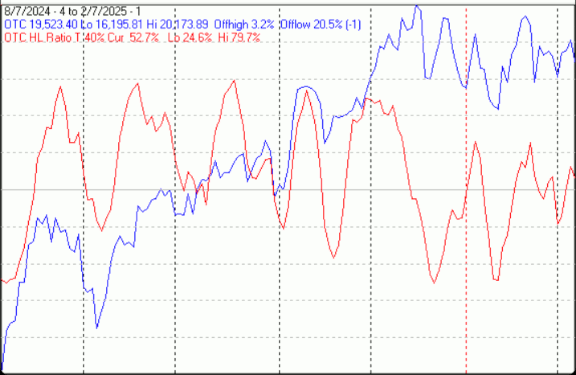 The next chart covers the past 6 months showing the OTC in blue and a 10% trend (19 day EMA) of NASDAQ new lows (OTC NL) in brown. OTC NL has been plotted on an inverted Y axis so decreasing numbers of new lows move the indicator upward (up is good). OTC NL stalled; nothing here.
 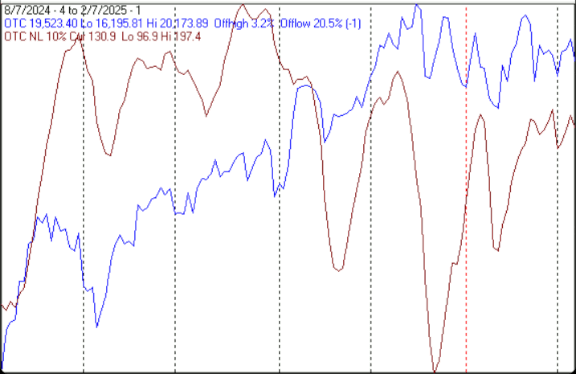 The next chart is similar to the one above except it shows the SPX in red and NY NL, in blue, has been calculated with NYSE data.NY NL paused its upward move to take a nap.
  SeasonalityNext week includes the 5 trading days prior to the 2nd Friday of February during the 1st year of the Presidential Cycle. The tables below show the daily change, on a percentage basis, for that period. OTC data covers the period from 1963 to 2024 while SPX data runs from 1953 to 2024. There are summaries for both the 1st year of the Presidential Cycle and all years combined. Prior to 1953 the market traded 6 days a week so that data has been ignored.Seasonally for next week has been mostly negative. Report for the week before the 2nd Friday of February.The number following the year is the position in the Presidential Cycle.Daily returns from Monday to 2nd Friday. OTC Presidential Year 1 (PY1) Year Mon Tue Wed Thur Fri Totals 1965-1 -0.33% -0.25% 0.53% -1.38% -0.59% -2.03% 1969-1 0.00% 0.25% -0.23% 0.32% 0.00% 0.34% 1973-1 -0.36% -0.38% 0.21% -1.01% -0.82% -2.36% 1977-1 -0.13% -0.02% -0.62% 0.31% -0.21% -0.67% 1981-1 -0.48% -0.12% -0.45% -0.61% -0.37% -2.03% Avg -0.33% -0.10% -0.11% -0.47% -0.50% -1.35% 1985-1 0.84% 0.69% 0.62% 0.96% 0.40% 3.51% 1989-1 -0.09% 0.79% -0.30% -0.39% -0.99% -0.98% 1993-1 -0.36% -0.89% 0.41% 0.12% -0.77% -1.49% 1997-1 -1.65% -0.29% 2.07% 0.86% -0.26% 0.74% 2001-1 -0.65% 0.81% -2.13% -1.75% -3.56% -7.28% Avg -0.38% 0.22% 0.13% -0.04% -1.03% -1.10% 2005-1 -0.22% 0.22% -1.64% 0.03% 1.15% -0.46% 2009-1 -0.01% -4.20% 0.38% 0.73% -0.48% -3.57% 2013-1 -1.51% 1.29% -0.10% -0.11% 0.91% 0.49% 2017-1 -0.06% 0.19% 0.15% 0.58% 0.33% 1.18% 2021-1 0.95% 0.14% -0.25% 0.38% 0.50% 1.72% Avg -0.17% -0.47% -0.29% 0.32% 0.48% -0.13% OTC summary for PY1 (1965 – 2021 Avg -0.29% -0.12% -0.09% -0.06% -0.34% -0.86% Win% 14% 53% 47% 60% 36% 40% OTC summary for all years 1963 – 2024 Avg -0.16% 0.09% 0.09% 0.12% 0.01% 0.16% Win% 38% 61% 56% 65% 61% 58%
SPX PY1 Year Mon Tue Wed Thur Fri Totals 1953-1 -0.46% -0.27% 0.08% 0.00% 0.39% -0.27% 1957-1 -0.20% -1.44% -0.16% -0.46% -0.69% -2.94% 1961-1 -0.74% -0.18% 0.91% -0.31% -0.84% -1.15% 1965-1 -0.39% 0.33% -0.89% -1.06% 0.74% -1.28% 1969-1 0.00% 0.12% -0.98% 1.05% -0.10% 0.09% 1973-1 -0.10% 0.19% -0.69% -0.44% 1.34% 0.30% 1977-1 0.01% -0.28% -0.86% 0.09% -0.60% -1.64% 1981-1 -1.02% -0.02% -0.77% -0.59% -0.39% -2.80% Avg -0.38% 0.07% -0.84% -0.19% 0.20% -1.07% 1985-1 0.96% 0.14% -0.10% 0.77% 0.20% 1.98% 1989-1 -0.31% 1.21% -0.33% -0.87% -1.36% -1.66% 1993-1 -0.24% -0.56% 0.20% 0.32% -0.69% -0.97% 1997-1 -0.52% 0.53% 1.67% 1.13% -0.41% 2.39% 2001-1 0.36% -0.15% -0.84% -0.62% -1.33% -2.59% Avg 0.05% 0.23% 0.12% 0.15% -0.72% -0.17% 2005-1 -0.11% 0.05% -0.86% 0.42% 0.69% 0.20% 2009-1 0.15% -4.91% 0.80% 0.17% -1.00% -4.79% 2013-1 -1.15% 1.04% 0.05% -0.18% 0.57% 0.33% 2017-1 -0.21% 0.02% 0.07% 0.58% 0.36% 0.81% 2021-1 0.74% -0.11% -0.03% 0.17% 0.47% 1.23% Avg -0.12% -0.78% 0.01% 0.23% 0.22% -0.45% SPX summary for PY1 1953 – 2021 Avg -0.19% -0.24% -0.15% 0.01% -0.15% -0.71% Win% 29% 50% 39% 53% 44% 44% SPX summary for all years 1953 – 2024 Avg -0.28% 0.00% 0.12% -0.08% 0.07% -0.17% Win% 37% 54% 57% 44% 56% 57% ConclusionWatching political events was much more interesting than watching the market last week.Seasonality has been weak during the 2nd week of February.The strongest sectors last week were Precious Metals (for the 3rd week) and Telecomm while the weakest were Transportation and Energy (for the 3rd week in a row).I expect the major averages to be lower on Friday February 14 than they were on Friday February 7. Last week all of the major indices were down, so I am calling last weeks positive forecast a loss. More By This Author:Technical Market Report For February 1, 2025
Technical Market Report For January 25, 2025
Technical Market Report For January 18, 2025


