Gold prices turned lower as the US Dollar mounted a recovery from the previous day’s losses, undermining the appeal of anti-fiat assets. From here, a lull in top-tier data flow keeps the focus on prospects for passing a US tax cut reform. That puts the yellow metal at the mercy of incoming headlines as investors await the release of the Senate’s version of a tax reform proposal.
Crude oil price stalled after hitting the highest level since July 2015 as the impact of Saudi-inspired geopolitical worries eased. The situation did not materially improve but traders seemed unwilling to continue pressing the narrative until a trade-able cause and effect relationship between recent events and global asset prices became apparent.
The weekly set of inventory flow statistics from the EIA is now in the spotlight. Median forecasts point to a drawdown of 2.2 million barrels but analogous API data released yesterday predicted a smaller 1.56 million barrel outflow. If that proves to foreshadow a disappointment on today’s official release, prices may face renewed selling pressure.
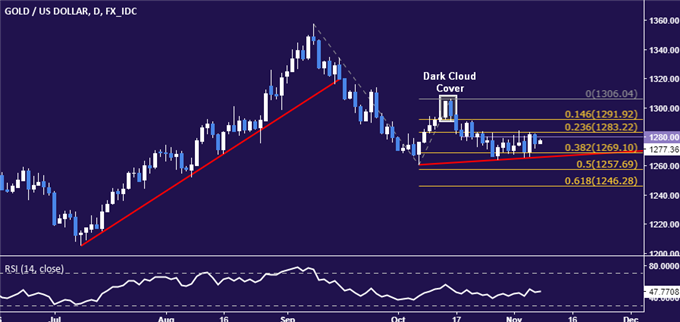
GOLD TECHNICAL ANALYSIS – Gold prices continue to struggle for direction in a narrow range. A daily close above the 23.6% Fibonacci expansion at 1283.22 exposes the 14.6% level at 1291.92. Alternatively, a reversal below the 1266.16-69.10 area (trend line, 38.2% Fib) targets the 50% expansion at 1257.69.

Chart created using TradingView
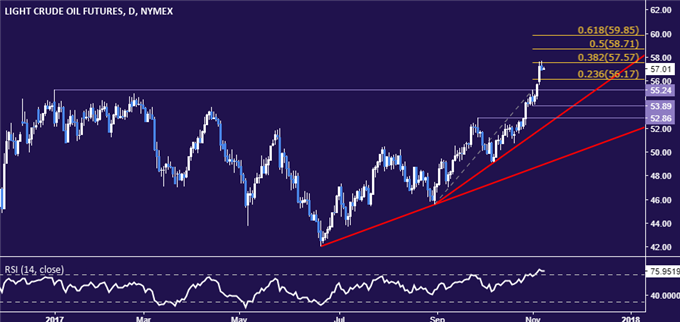
CRUDE OIL TECHNICAL ANALYSIS – Crude oil prices paused to digest gains after testing resistance at 57.57, the 38.2% Fibonacci expansion. A daily close above this barrier opens the door for a challenge of the 50% level at 58.71. Alternatively, a reversal below the 23.6% Fib at 56.17 paves the way for a retest of resistance-turned-support at 55.24, the January 3 high.

Chart created using TradingView


