
Ticker
Last
High
Low
Daily Change (pip)
Daily Range (pip)
USD/JPY
112.74
112.87
112.33
19
54
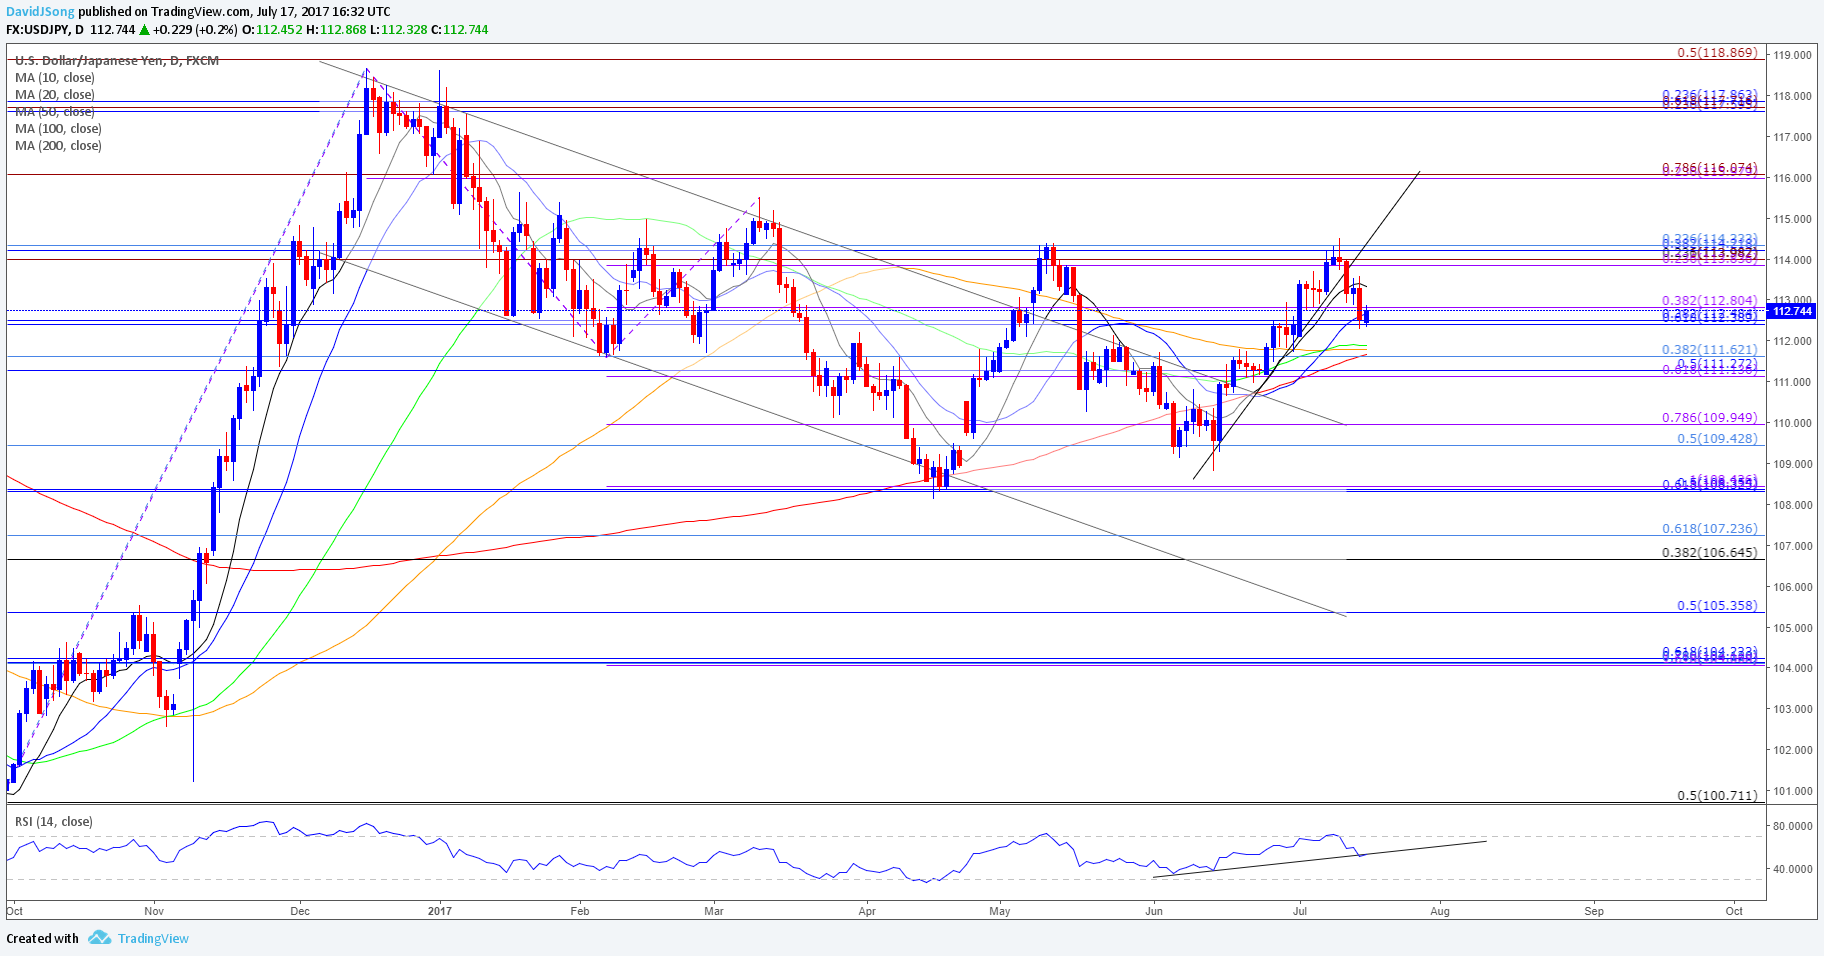
USD/JPY may continue to give back rebound from the June-low (108.80) as market participants push back bets for the next Fed rate-hike.
The Bank of Japan’s (BoJ) July 20 meeting is likely to spark a limited reaction in USD/JPY as Governor Haruhiko Kuroda and Co. stick to the Quantitative/Qualitative Easing (QQE) Program with Yield-Curve Control, and narrowing bets for higher U.S. borrowing-costs may continue to drag on the dollar-yen exchange rate as Chair Janet Yellen warns ‘the federal funds rate would not have to rise all that much further to get to a neutral policy stance.’ With Fed Fund Futures pricing a 50% probability for a move in December, USD/JPY stands at risk of facing range-bound conditions over the near-term amid waning expectations for three rate-hikes in 2017.
USD/JPY Daily

Ticker
Last
High
Low
Daily Change (pip)
Daily Range (pip)
GBP/USD
1.3059
1.3117
1.3051
41
66


