The minimum wage has often been a contentious issue, and in 2017 the debate shows no sign of wearing.
On the one hand, there are many people struggling to make ends meet, and a higher minimum wage could certainly impact the 10 million working poor spread throughout the country. Not only would it help some of these workers sustain better living standards, but some research also shows that an increase can actually help certain types of businesses, and that job losses from a higher wage are usually minimal.
From another angle, however, many economists see a higher minimum wage as any other supply and demand situation. Arbitrarily raising the price of labor limits the demand for that labor – and in places like Seattle, recent studies have shown that the minimum wage increase is hurting the people it is supposed to help.
To complicate things even further, the prospect of increased automation in the workplace is also a factor that affects these outcomes.
THE REAL MINIMUM WAGE IN CONTEXT
Putting this debate aside, today’s visualization from cost information site HowMuch.net reveals some interesting points to consider about the minimum wage, which help put the numbers in context.
By adjusting the minimum wage for the Consumer Price Index (CPI) over time, it shows that in the last 25 years there has been no real increase in the minimum wage. Inflation has quickly erased any adjustments, keeping it stagnant for years.
Further, in real terms, the minimum wage peaked in value in 1968, just before Nixon severed the connection between the dollar and gold. In the inflationary years that followed, the real minimum wage eventually dropped to $6.77, a staggering 41.0% decrease. The real wage has basically hovered between $6.50 and $8.00 ever since.

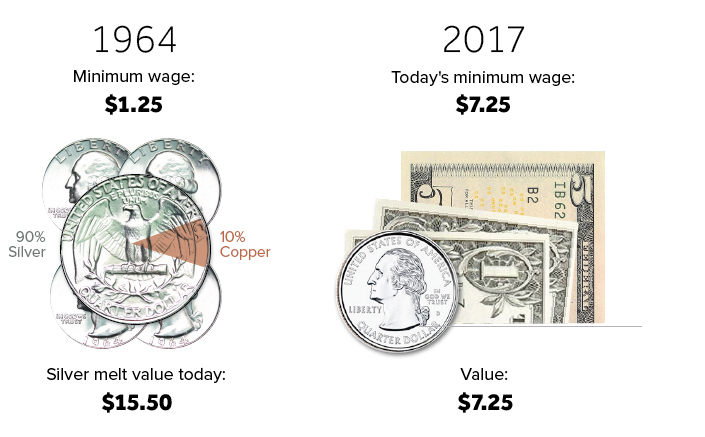
Precious metals advocates make an important point about this: the minimum wage in nominal terms in 1964 was $1.25, or five silver quarters. If you were to cash in that silver today (~$17.15 per oz), the melt value would be $15.50, which is actually double the current minimum wage.


