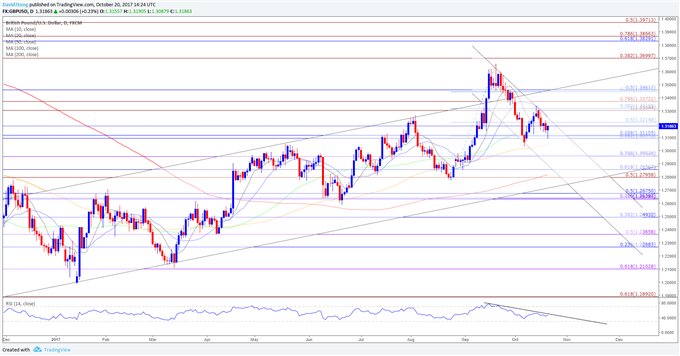


Fresh comments from U.K. Prime Minister Theresa May appear to be propping up the British Pound, with GBP/USD bouncing back from a fresh weekly-low (1.3088), but another batch of lackluster data prints may undermine the near-term rebound in the exchange rate as it encourages the Bank of England (BoE) to keep the benchmark interest rate at the record-low.
Fears of a ‘hard Brexit’ appear to dissipating as Prime Minister May pledges to draw up a contingency plan and expresses that the government wants European Union (EU) nationals to stay in the U.K. even if they fail to strike a deal, but the growing rift within the Conservative party may continue to weigh on the British Pound as the threat of a possible shift in leadership looms. With that said, GBP/USD may larger preserve the monthly-opening range ahead of the next Bank of England (BoE) interest rate decision on November 2, but Governor Mark Carney and Co. may look to ‘withdrawal of part of the stimulus that the Committee had injected in August last year would help to moderate the inflation overshoot while leaving monetary policy very supportive.’
Keep in mind, the BoE is likely to reiterate that ‘some withdrawal of monetary stimulus is likely to be appropriate over the coming months in order to return inflation sustainably to target,’ but the Monetary Policy Committee (MPC) may tame expectations for a series of rate-hikes especially as the 3Q U.K. Gross Domestic Product (GDP) report is anticipated to show the growth rate slowing to an annualized 1.4% from 1.5% during the three-months through June.
GBP/USD Daily Chart


