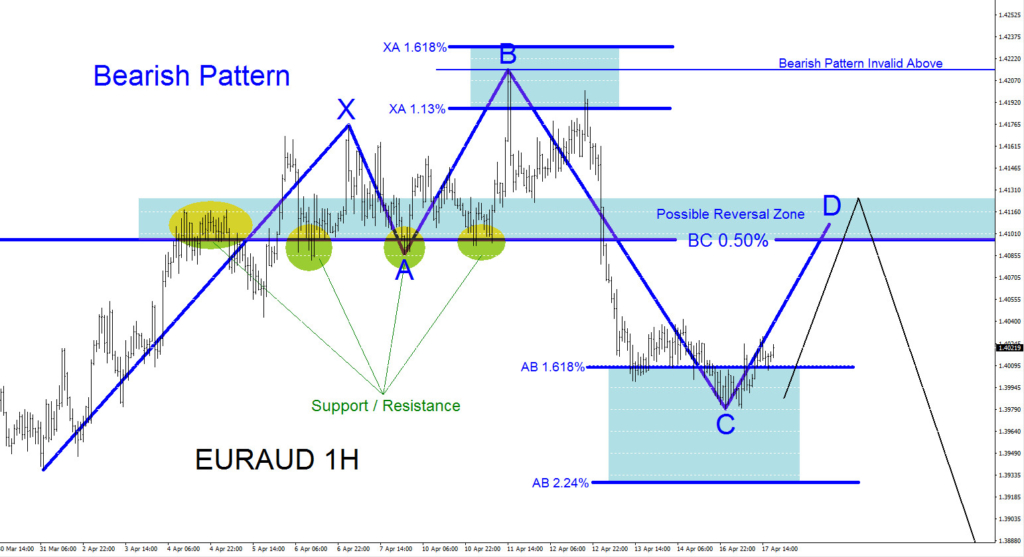
On April 11/2017 bears pushed EUR/AUD lower and it seems lower prices are yet to come in the following trading sessions. At the current moment, bias remains bearish and traders should look for any possible selling opportunities.
1 Hour Chart Bearish Pattern: A bearish pattern is visible on short term analysis but traders need to be patient and wait for the price to retrace higher towards the BC 0.50% Fib. retracement level and wait for the point D (blue pattern) to enter the possible reversal zone (blue box) to trigger sells. We do not recommend buying the pair to the proposed selling zone but rather advise to wait for price to enter the possible reversal zone and look for selling opportunities. There is also support/resistance levels near the BC 0.50% Fib. level so we should expect a reaction/reversal in price action in this area. Only time will tell what EURAUD will do but for now bias remains bearish.

If looking to sell EUR/AUD traders should wait for the price to move above the BC 0.50% and watch for price to stall in the possible reversal zone (blue box) for any selling opportunities. Waiting for price to move above the BC 0.50% Fib. retracement level will offer a better risk/reward trade setup. A break above the point B high will invalidate the bearish pattern. If the pair moves lower from the possible reversal zone traders should place targets below the AB 2.24% level.
Of course, like any strategy/technique, there will be times when the strategy/technique fails so proper money/risk management should always be used on every trade.


