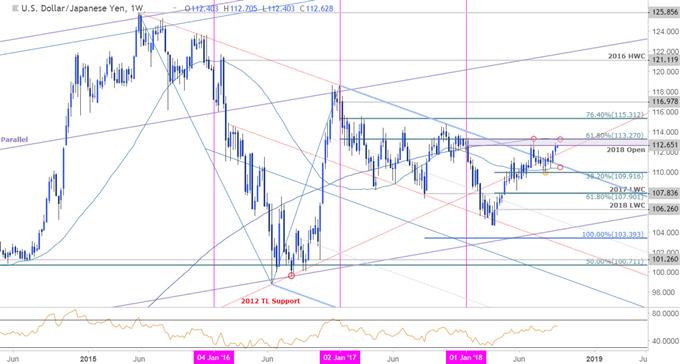
In this series we scale-back and take a look at the broader technical picture to gain a bit more perspective on where we are in trend. The Japanese Yen is trading just below yearly range resistance with the FOMC interest rate decision on tap this week. Here are the key targets & invalidation levels that matter on the USD/JPY weekly chart
USD/JPY WEEKLY PRICE CHART

Notes: The yen has been under pressure for the last three weeks with USD/JPY approaching a key resistance range at 112.65-113.27. This region is defined by the 2018 open, the 200-week moving average and the 61.8% retracement of the 2017 decline. Note that this zone stands just pips from the objective yearly opening-range highs at 113.38.
A breach above this threshold targets subsequent topside resistance objectives at 115.31 and the 2017 open at 116.98. Initial weekly support stands at the 52-week moving average / former trendline resistance at ~110.40 with a break below 109.92 needed to suggest that a larger price reversal is underway.
Bottom line: The USD/JPY rally remains vulnerable heading into this key resistance range. From a trading standpoint, the near-term opportunity may be to fade against this threshold but we’ll need some convincing price action to warrant such a trade. A weekly close above would be needed to validate the breakout but for now, I’m looking for exhaustion.
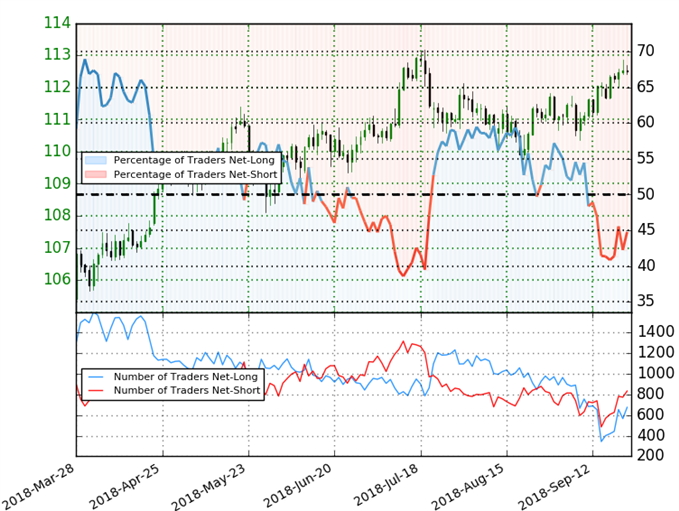
USD/JPY TRADER SENTIMENT


