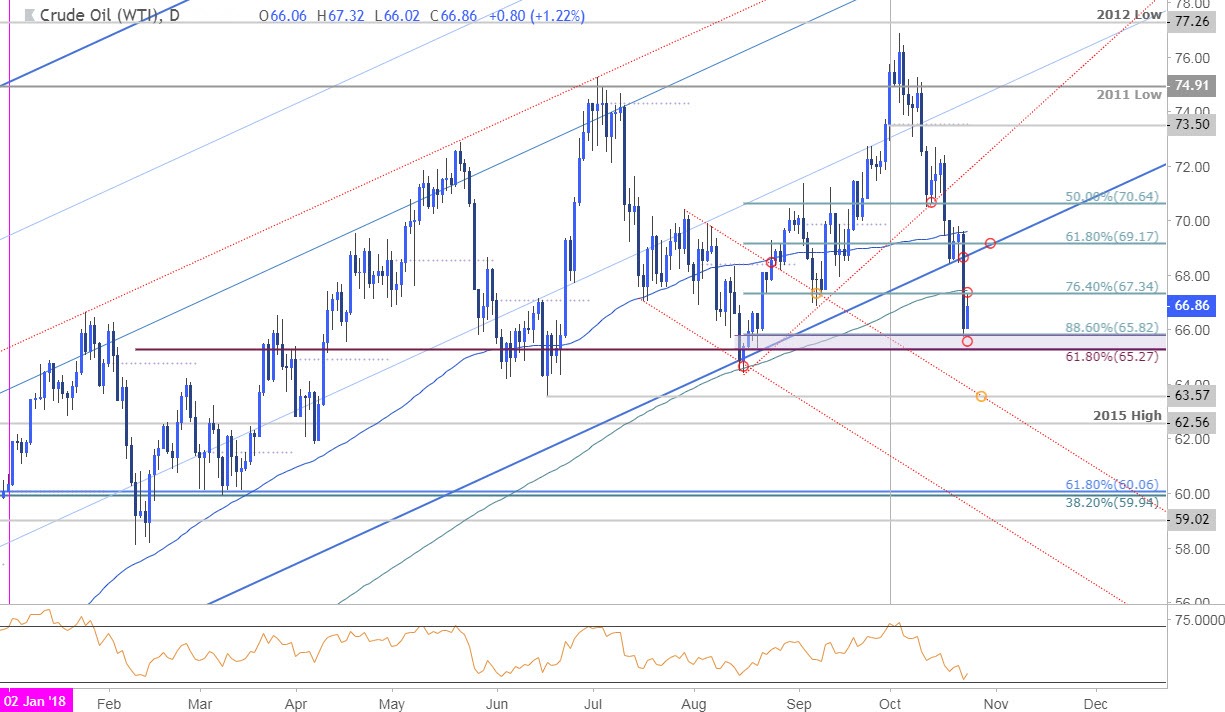
Crude prices have plummeted more than 13% from the yearly/monthly high with the decline now approaching the first major support hurdle. Here are the updated targets and invalidation levels that matter on the Crude Oil (USOil) charts.
CRUDE OIL DAILY PRICE CHART

Technical Outlook: In our latest Crude Oil Weekly Technical Outlook, we noted expectations for a reaction as the price was approaching multi-year uptrends support. Yesterday’s sell-off saw prices accelerate through this key zone with the decline taking out targets into the first major support hurdle at 65.27/82. This region is defined by the 88.6% retracement of the August advance, the June & August low-day reversal closes and the 61.8% retracement of the yearly range. Initial resistance now stands with the 200-day moving average at 67.34/45 with bearish invalidation now lowered to 69.17.
CRUDE OIL 240 PRICE CHART

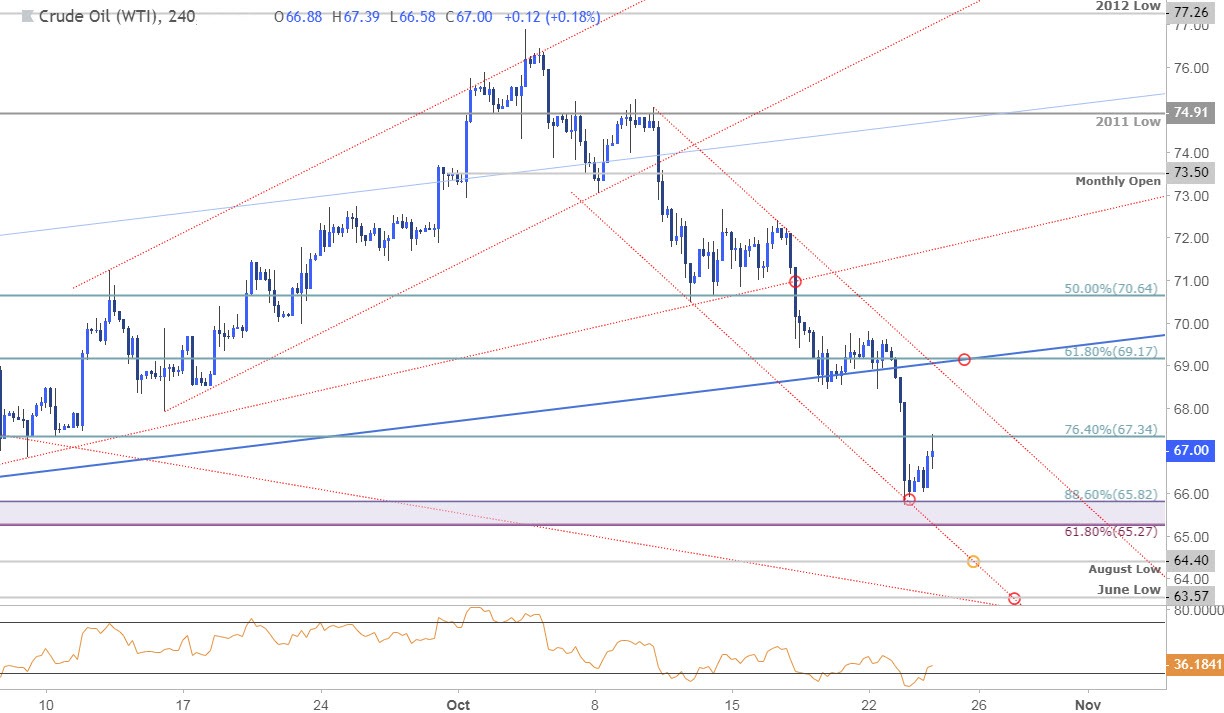
Notes: A closer look at price action shows crude trading within the confines of near-term descending channel formation with price rebounding off confluence support today at the 65.27/82 pivot zone. A break/close below this level keeps the focus lower with such a scenario targeting subsequent support objectives at 64.40 and the June low at 63.57.
Bottom line: Crude prices are testing a key technical support pivot with the immediate decline at risk while above 65.27. Ultimately a recovery would offer more favorable short-entries closer to down-trend resistance. From a trading standpoint, we’re on the lookout for signs of near-term price exhaustion- a good spot to reduce short-exposure / lower protective stops.
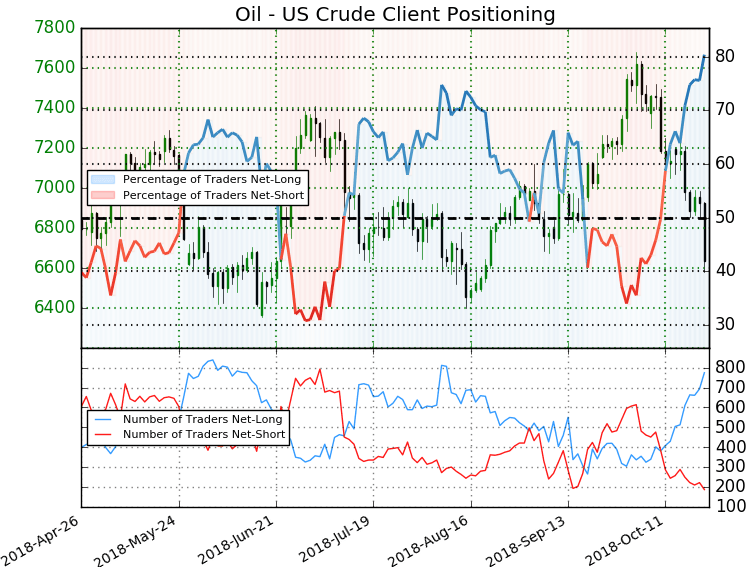
CRUDE OIL TRADER SENTIMENT


