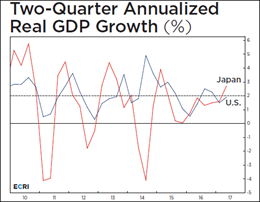
ECRI Weekly Leading Index: WLI Down
Sep 10, 2017
Jeremy Parkinson
Finance
The latest release of the publicly available data from ECRI puts its Weekly Leading Index (WLI) at 141.8, down from the previous week. Year-over-year the four-week moving average of the indicator is now at 3.69%, down from 4.36% last week. The WLI Growth indicator is now at 0.9, also down from the previous week. “Finding […]
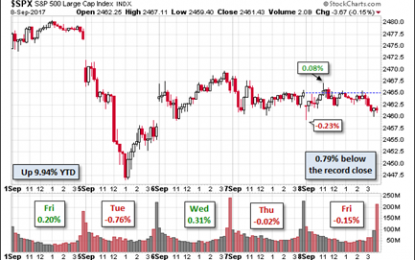
Weighing The Week Ahead: Have The Odds Improved For A Market-Friendly Policy Agenda?
Sep 10, 2017
Jeremy Parkinson
Finance
We have a normal data calendar. Central to stock market prospects is the resolution of several key policy issues. The possible outcomes have a wide range of market impacts, from fear to a major boost in corporate earnings. The debt limit/Harvey aid deal between President Trump and Democrats was a surprise to most. Still digesting […]
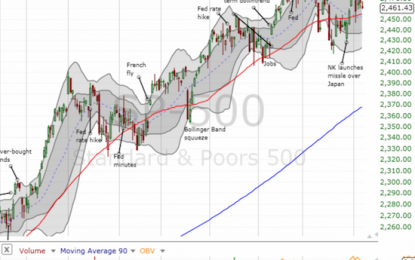
Above The 40 – Lingering Tensions For The Stock Market
Sep 10, 2017
Jeremy Parkinson
Finance
AT40 = 44.9% of stocks are trading above their respective 40-day moving averages (DMAs) AT200 = 48.9% of stocks are trading above their respective 200DMAs VIX = 12.1 (up 4.9%)Short-term Trading Call: neutral Commentary The market has made no progress since my last Above the 40 post which covered the volatility and fizzle from Tuesday, September 5th. Tensions remain […]
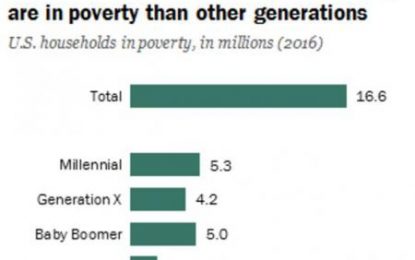
Millennials Head One-Third Of All Poverty-Stricken U.S. Households (The Rest Live With Mom)
Sep 10, 2017
Jeremy Parkinson
Finance
Millennials just can’t catch a break. Despite being the most educated generation ever to walk the face of the planet, at least according to their tuition bills paid by mom and dad, a staggering number of them now head households living below the poverty line…and that excludes the ones forced to live at home with […]
Why So Much Inventory?
Sep 10, 2017
Jeremy Parkinson
Finance
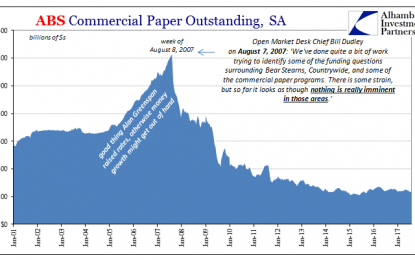
Liquidity, and more so liquidity preferences are vastly misunderstood for a whole host of reasons. A lot of it has to do with the dominant strains of economics battling each other (saltwater vs. freshwater) over which statistical model fails less frequently. In shifting to mathematics and statistics, something great has been lost. Economists don’t understand […]
EUR/USD Forecast Sep. 11-15
Sep 10, 2017
Jeremy Parkinson
Finance
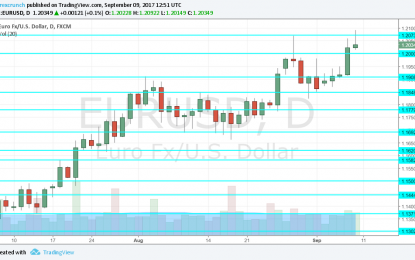
EUR/USD was not convinced by Draghi’s complaints about the exchange rate and reached new highs. Can it continue even higher? A mix of inflation, industrial output, and trade balance numbers awaits us. Here is an outlook for the highlights of this week and an updated technical analysis for EUR/USD. The ECB did not reach a decision about […]

Irma Delays Uptrend
Sep 10, 2017
Jeremy Parkinson
Finance
Current Position of the Market SPX Long-term trend: The uptrend should continue after pausing for a correction. SPX Intermediate trend: Unconfirmed sell signal. Analysis of the short-term trend is done on a daily-basis with the help of hourly charts. It is an important adjunct to the analysis of daily and weekly charts which discuss longer […]

Technical Market Report For September 9, 2017
Sep 09, 2017
Jeremy Parkinson
Finance
The good news is: In spite of a down week for the indices, the breadth indicators held up well last week. The Negatives There is not much to complain about. The Nasdaq composite (OTC) was the worst performer among the major indices, down 1.16% last week while the S&P 500 (SPX) was the best performer, […]

Crude Oil Struggles To Maintain Weekly Gain As Irma Pressure Arrives
Sep 09, 2017
Jeremy Parkinson
Finance
Talking Points: Hurricane Irma could be US’ most costly, Florida is 4th biggest oil consumption state Two hurricanes behind Irma, Katia and Jose could also pose demand risk Baker Hughes Data shows US Oil Rig Count Falls 3 to 756 active US oil rigs IGCS data showing US Crude client short positioning increases 56% WoW, favoring upside Fundamental Forecast […]

5 Charts On Chinese Inflation Trends
Sep 09, 2017
Jeremy Parkinson
Finance
The August inflation numbers for China have just been released, so it’s a good opportunity to dust off a number of the Chinese inflation charts. The headline stats: CPI inflation was 1.8% y/y (1.7% expected, 1.4% previous) and PPI inflation was 6.3% (5.7% expected, 5.5% previous). Basically China’s August inflation numbers surprised to the upside, […]


