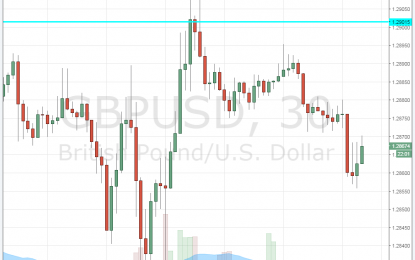
UK Construction PMI Beats With 56 – GBP Focused On The Elections
Jun 02, 2017Jeremy Parkinson0
Markit’s purchasing managers’ index for the construction sector was expected to show a small slide to 52.7 in May after 53.1 back in April. This is the second PMI after yesterday’s manufacturing one that came out at 56.7, within expectations. GBP/USD was trading around 1.2860 ahead of the publication. Resistance awaits at 1.29, followed by 1.2980 and […]

Indian Indices Trade On A Positive Note; Telecom Stocks Witness Buying
Jun 02, 2017Jeremy Parkinson0
Stock markets in India have continued their momentum and are presently trading on a positive note. Sectoral indices are trading in the green with stocks in the telecom sector and healthcare sector witnessing maximum buying interest. The BSE Sensex is trading up 119 points (up 0.4%) and the NSE Nifty is trading up 32 points (up 0.3%). The BSE Mid Cap index is trading up by […]
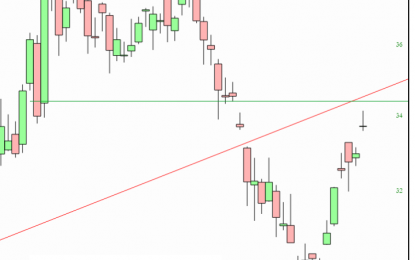
Short The Junior Miners
May 17, 2017Jeremy Parkinson0
My stop loss…….34.41. I would normally do a post like this just for my beloved PLUS members, but I’m in a generous mood.
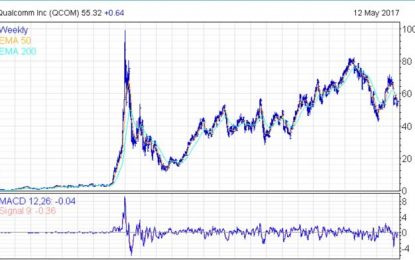
Qualcomm Is Racing Ahead. Its Stock Is Dead In The Water. What Gives?
May 17, 2017Jeremy Parkinson0
Apple (AAPL), Microsoft (MSFT), Alphabet (Google’s parent – GOOG), Facebook (FB), and Amazon (AMZN) are all consumer as well as investor favorites. As consumers, we might respect a product or service and get excited about the company’s stock. When a company supplies the backbone for what other companies do, however, we can’t simply use the […]
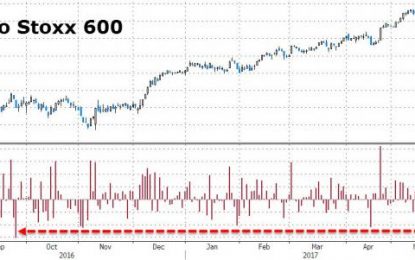
“Trump Doesn’t Matter”? European Stocks Slump Most In 8 Months
May 17, 2017Jeremy Parkinson0
Again and again we were told that this rally was all about fun-durr-mentals and that anything Trump did was gravy and not priced into markets… so how do you explain the biggest plunge in European stocks since September today… on zero fundamental catalysts? And banks were battered…
Is This Bitcoin’s Fatal Flaw?
May 17, 2017Jeremy Parkinson0
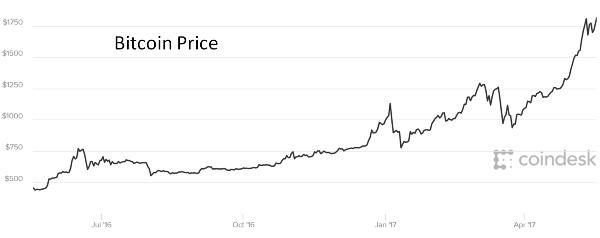
Bitcon has been rocketing higher lately, as it gains widespread official approval and more people figure out how to use it. As the first of its kind to emerge, bitcoin has become synonymous with “cryptocurrency”. But lately it’s been joined by a lot of others – which together now account for more than half of […]
The VIX Is Back To Pre-Crisis Lows. Does It Matter?
May 17, 2017Jeremy Parkinson0
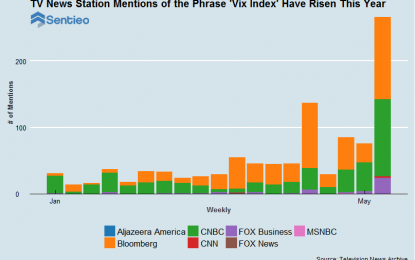
Written by Sentieo The CBOE Vix Index is a popular measure of the implied volatility of the S&P 500 index options, calculated and published by the Chicago Board Options Exchange. The Sky – Is It Falling? If you watch major business news channels, you may have recently heard that the last time the VIX fell to its current […]
Tell The Alarmists To Calm Down, The Debt Crisis Is Not Coming Back
May 17, 2017Jeremy Parkinson0
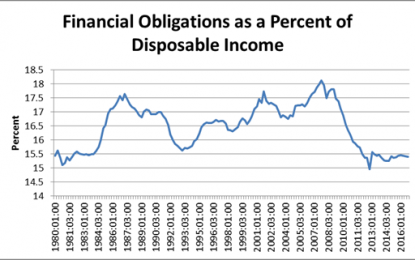
There were a number of articles about the scary news that debt levels are again above their housing bubble peaks. If you need something to be scared about (really?) I suppose you can worry about this, but if you want to seriously consider the economic impact of this data point, there ain’t much there. There are two big differences […]

String Of Q1 Earnings Beat Fail To Drive Insurance ETFs
May 17, 2017Jeremy Parkinson0
After a stellar ride early in 2017, the insurance industry has lost its momentum despite the fact that it tends to flourish with a rise in interest rates. With a Fed rate hike in March and another lift-off expected next month, the stocks are not as strong as they should ideally be. Even robust earnings […]


