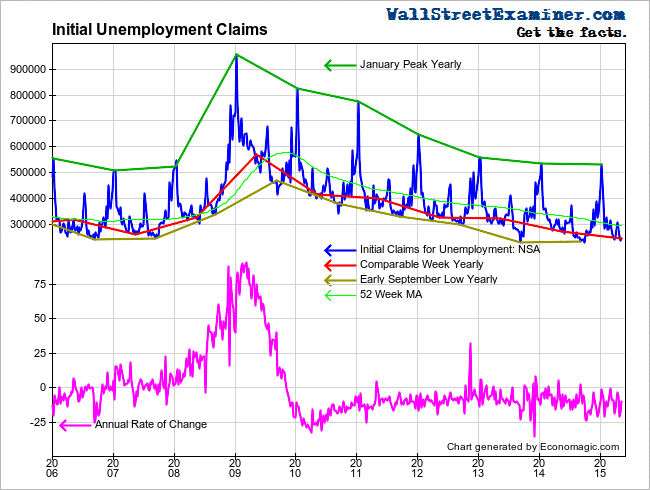
The headline, fictional, seasonally adjusted (SA) number of initial unemployment claims for last week came in at 264,000, beating the Wall Street conomist crowd consensus guess of 285,000. For the second time in 3 weeks the mainstream media headline writers crowed about the 15 year record low. In reality, on the basis of the actual data before seasonal maladjustment, the numbers have consistently been at, near, or below record lows since September 2013, suggesting an overstretched, bubble economy at full boil for 20 months.
The Department of Labor also reports actual, unmanipulated numbers. This week it said, “The advance number of actual initial claims under state programs, unadjusted, totaled 242,640 in the week ending May 9, an increase of 6,219 (or 2.6 percent) from the previous week. The seasonal factors had expected an increase of 7,430 (or 3.1 percent) from the previous week. There were 270,738 initial claims in the comparable week in 2014. ”

Initial Claims and Annual Rate of Change- Click to enlarge
In terms of the trend over the longer term, actual claims were 10.4% lower than the same week a year ago. Since 2010 the annual change rate has mostly fluctuated between -5% and -15%. This week’s data was in the middle of that range.
On the basis of the week to week change was near the average reading for this week of May. This week is a swing week with some up weeks but mostly down weeks in the prior 10 years. The actual decline of 6,000 (rounded) compared with the 10 year average decrease for that week of 5,600 (rounded). Claims decreased by 18,000 in the comparable week last year.
There were 1,715 claims per million of nonfarm payroll employees in the current week. This was a record low, well below the May 2007 level of 1,897 record low for that week of May. That occurred well after the peak of the housing bubble but before the carnage of mass layoffs that was to begin later that year.


