(T2108 measures the percentage of stocks trading above their respective 40-day moving averages [DMAs]. It helps to identify extremes in market sentiment that are likely to reverse. To learn more about it, see my T2108 Resource Page. You can follow real-time T2108 commentary on twitter using the #T2108 hashtag. T2108-related trades and other trades are occasionally posted on twitter using the #120trade hashtag. T2107 measures the percentage of stocks trading above their respective 200DMAs)
T2108 Status: 48.8%
T2107 Status: 51.7%
VIX Status: 12.9 (down 15%)
General (Short-term) Trading Call: Neutral.
Active T2108 periods: Day #139 over 20%, Day #98 above 30%, Day #42 above 40% (overperiod), Day #4 under 50% (underperiod), Day #8 under 60%, Day #208 under 70%
Reference Charts (click for view of last 6 months from Stockcharts.com):
S&P 500 or SPY
SDS (ProShares UltraShort S&P500)
U.S. Dollar Index (volatility index)
EEM (iShares MSCI Emerging Markets)
VIX (volatility index)
VXX (iPath S&P 500 VIX Short-Term Futures ETN)
EWG (iShares MSCI Germany Index Fund)
CAT (Caterpillar).
Commentary
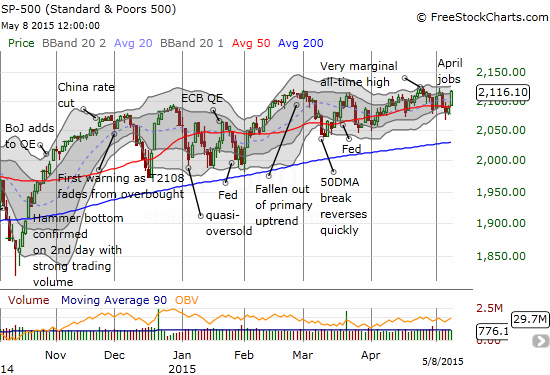
The S&P 500 (SPY) is up 2.8% year-to-date….exactly twice the gain of 1.4% achieved on Friday. No wonder market observers can still generate excitement on a big rally day that rests firmly within an on-going chopfest.

The S&P 500 continues to take 2 steps forward and 1 1/2 back: half the gains for 2015 came on Friday
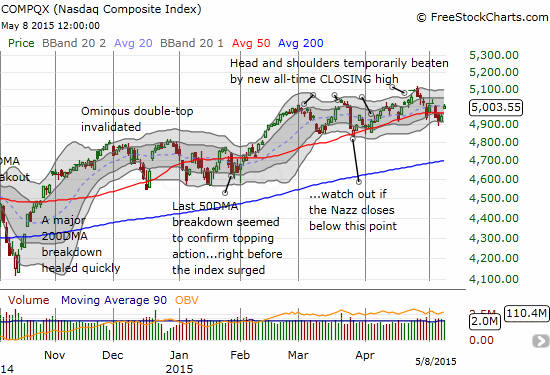
The NASDAQ (QQQ) is also following along its 50DMA and spending a little more time above support than below.

The NASDAQ’s push higher is a little clearer than the S&P 500
T2108 is still lagging the S&P 500. The last bout of churn took T2108 as low as 38% last week. It closed Friday at 48.9%. This level means the market has plenty of upside potential. Yet, if previous patterns from this chopfest hold, the S&P 500 will barely scratch out a new marginal all-time high before proceeding to chop its way back to the bottom of its narrow trading (upwardly biased) channel.


