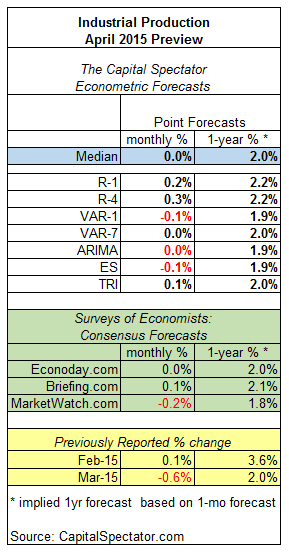
No change is expected for US industrial production in tomorrow’s April report vs. the previous month, according to The Capital Spectator’s median point forecast for several econometric estimates. The median prediction of flat performance represents an improvement over March’s steep 0.6% decline. April forecasts of industrial activity based on recent surveys of economists range from a modest decrease to a slight gain for the monthly comparison.
Translating the monthly forecasts into year-over-year changes implies that the growth rate for industrial output will remain relatively soft through April in comparison with recent history.
Here’s a closer look at the numbers, followed by brief summaries of the methodologies behind the forecasts that are used to calculate The Capital Spectator’s median prediction:

R-1: A linear regression model using the ISM Manufacturing Index to predict industrial production. The historical relationship between the variables is applied to the more recently updated ISM data to project industrial production. The computations are run in R.
R-4: A linear regression model using four variables to project industrial production: US private payrolls, an index of weekly hours worked for production/nonsupervisory employees in private industries, the ISM Manufacturing Index, and the stock market (Wilshire 5000). The historical relationships between the variables are applied to the more recently updated data to project industrial production. The computations are run in R.
VAR-1: A vector autoregression model using the ISM Manufacturing Index to predict industrial production. VAR analyzes the interdependent relationships of the variables through history. The forecasts are run in R using the “vars” package.
VAR-7: A vector autoregression model using seven variables to project industrial production: US private payrolls, an index of weekly hours worked for production/nonsupervisory employees in private industries, the ISM Manufacturing Index, the stock market (Wilshire 5000), real personal income less current transfer receipts, real personal consumption expenditures, and oil prices. VAR analyzes the interdependent relationships through history. The forecasts are run in R using the “vars” package.


