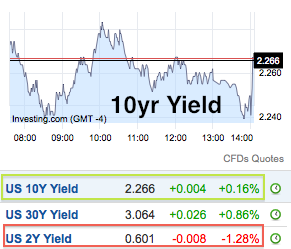
The 10 vs. 2 year yield spread is up slightly and the 30 vs. 2 is up significantly. This continues a trend of late that brings the yield curve further into the discussion as it has for weeks now refused to go back down (this time).

Here is the live 30 vs. 5 showing a potential bottom. Is that a Golden Cross (of the MA’s 50 and 200) I see? Well, it’s a cross of two moving averages that usually does bring the opposite of what ‘Golden’ and ‘Death’ cross hypesters foresee. Good thing this is a ratio between two yields and maybe hypesters are too busy elsewhere, like in stocks or nominal stock markets or gold or ‘resources’ or…

Getting sidetracked now, I’ve said it a bunch of times before. When you see someone touting a cross of the 50 over or under the 200 in support of a bull or bear case, immediately tag that source as being naive, at best.
Moving on, USD breaks out of a Wedge (ha ha, you caught me; Rising and Falling Wedges may be the 2nd most hyped thing in TA). There is no implication beyond a retrace of 38% to 50% of the Wedge, which Uncle Buck has nearly done.

Adding Things 1 & 2 above together, a rising yield curve is a fundamental underpinning for a gold bullish case and a long-term trading case in the miners. A strong USD (over time) would also be helpful for the best (not necessarily most exciting) case for gold stocks. That would be for all the reasons I have gone on about over the years. No need to bloat this post further.


