I would like to show you some more charts on some if the different stock market indices we looked at in the last Weekend Report. Last weekend we looked at a lot of the bull market uptrend channels that are still in place since the 2009 crash low. It’s always important to keep an open mind no matter how strongly we believe things to be when it comes to the stock markets. Everyone can’t get in at the bottom and everyone can’t get out at the top and then there is the consolidation phase that trips up both the bull and the bears alike.
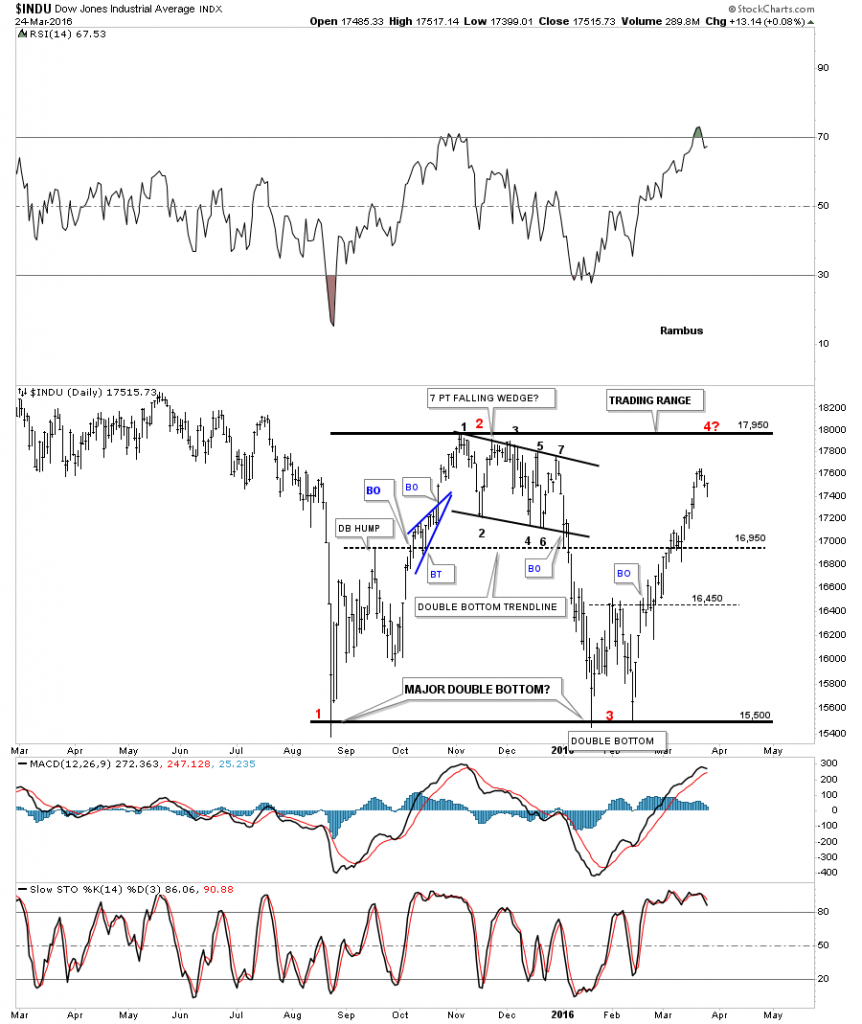
Lets start with a daily chart for the INDU which I’m showing a large trading range that began during last August’s big decline labeled with the red #1. The INDU then rallied back up to the 17,950 area, red #2, and started to form that seven point bearish falling flag which I thought was going to be a bull flag until the price action broke below the bottom rail which led the the second low in January and February of this year which formed a double bottom, red #3. The INDU has rallied strongly again and is within 435 points of reaching the top of the trading range again. Just for argument sake, if the INDU reaches the top of the trading range it will have completed the third reversal point at 17,950 which would be an odd number of reversal points creating a possible big double bottom. Keep in mind this is only one scenario at this time and there is a lot of work to do before we can even begin to call the price action a double bottom.

Below is basically the same chart as the one above which has the moving averages on it. This past week the 20 day ema crossed back above the 200 day simple ma with the 50 day ema now rising strongly. During big trading ranges like this it’s not uncommon to see them cross back and forth before either the bulls or the bears setup the next impulse move out of the trading range. Once that happens they will get a nice alignment to them that will show the impulse move.


