February 2016 Producer Prices Year-Over-Year Inflation Is Now Zero


The Producer Price Index year-over-year inflation is zero. The intermediate processing continues to show a large deflation in the supply chain – but the amount of deflation decreased.

The PPI represents inflation pressure (or lack thereof) that migrates into consumer price.

  • The BLS reported that the headline Producer Price Index (PPI) finished goods prices (now called final demand prices) year-over-year inflation rate dropped from -0.2 % to 0.0 %..
  • The market had been expecting (from Bloomberg):
  • month over month change Consensus Range Consensus Actual PPI-Final Demand (PPI-FD) -0.5 % to 0.0 % -0.2 % -0.2 % PPI-FD less food & energy (core PPI) -0.1 % to 0.2 % +0.1 % +0.0 % PPI-FD less food, energy & trade services 0.0 % to 0.3 % +0.1 % +0.1 %

    The producer price inflation breakdown:

    category month-over-month change year-over-year change final demand goods -0.6 %   final demand services +0.0 %   total final demand -0.2 % 0.0 % processed goods for intermediate demand -0.7 % -5.6 % unprocessed goods for intermediate demand -2.1 % -16.8 % services for intermediate demand +0.3 % +1.9 %

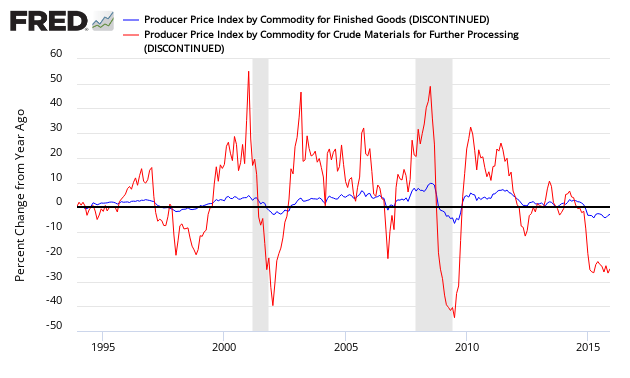
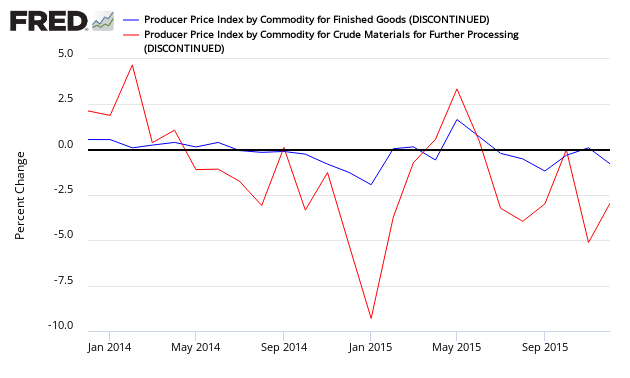
    In the following graph, one can see the relationship between the year-over-year change in crude good index and the finish goods index. When the crude goods growth falls under finish goods – it usually drags finished goods lower.

    Percent Change Year-over-Year – Comparing PPI Finished Goods (blue line) to PPI Crude Materials (red line)
    Percent Change Month-over-Month- Comparing PPI Finished Goods (blue line) to PPI Crude Materials (red line)
    Removing food and energy (core PPI) was originally done to remove the noise from the index, however the usefulness in the twenty-first century is questionable except in certain specific circumstance.

    Reviews

    • Total Score 0%
    User rating: 0.00% ( 0
    votes )


    Leave a Reply

    Your email address will not be published. Required fields are marked *