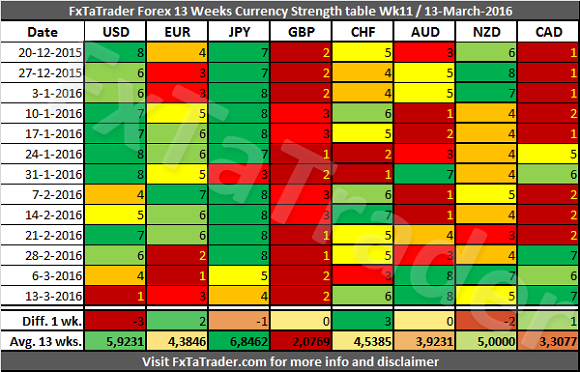
13 Weeks Currency Score Strength for Week 11 (beginning 13 March, 2016)
The 13 Weeks Currency Strength and the 13 Weeks Average are provided here below. This data and the “3 months currency classification” are considered for choosing the preferred range. Because it is not ideal nor desired to change the range for a currency every single week, we can make several checks to avoid this.

______________________________________
Forex Weekly Currency Score Comparison for Week 11
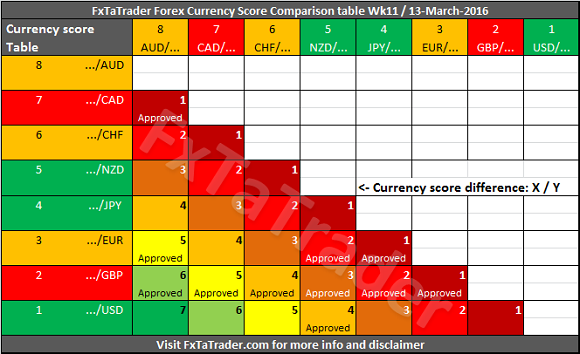
The Forex Currency Comparison Table compares each Currency with its counterpart based on the Currency Score. By using the comparison table here below you have a view where no volatility and statistics are used for comparing the currencies and strength. Only the strength of each currency against the counterparts has been analyzed by using the Technical analysis charts of the 4 Time Frames also used for the “Ranking and Rating List”. The information from the Comparison Table is the source for calculating the “Ranking and Rating List” with additionally the volatility and statistics for creating the best and worst performer in the list from number 1 to 28.

The additional analysis of this table compared to the Currency Score table is that the Comparison table compares the strength between the currencies of each pair. By subtracting the strength of the weaker currency from the stronger currency we have a way to compare each pair combination.
The comparison table provides a way to compare currencies from a longer term perspective of 13 weeks and at the same time taking the current development also into account. By coloring the currencies according to their Classification, see Forex Currency Score Classification for Wk9, we can show what the best combinations are. In doing this we apply two rules to make it all clear:


