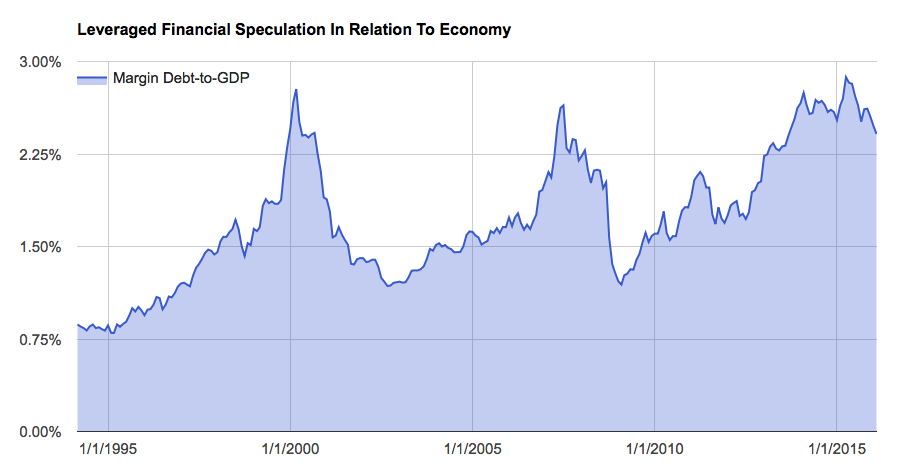

NYSE margin debt fell again during the month of February. After the selloff in stocks that kicked off 2016, this should come as no surprise. Investors are usually forced to reduce leveraged bets during these sorts of episodes in the stock market. In fact, this forced selling can actually exacerbate the volatility. And because margin debt is only now beginning to come down from record highs, surpassing those seen at the 2000 and 2007 peak, this should be of concern to most equity investors.
To fully appreciate this risk, I prefer to look at margin debt relative to overall economic activity. When leveraged financial speculation becomes large relative to the economy, it’s usually a sign investors have become far too greedy. As Warren Buffett would say, this is usually a good time to become more fearful, or conservative towards the stock market.
Not only did margin debt recently hit nominal record-highs, it hit new record-highs in relation to GDP, as well. In other words, over the past several decades, investors have never become so greedy as they did recently. And yes, this includes the dotcom bubble.

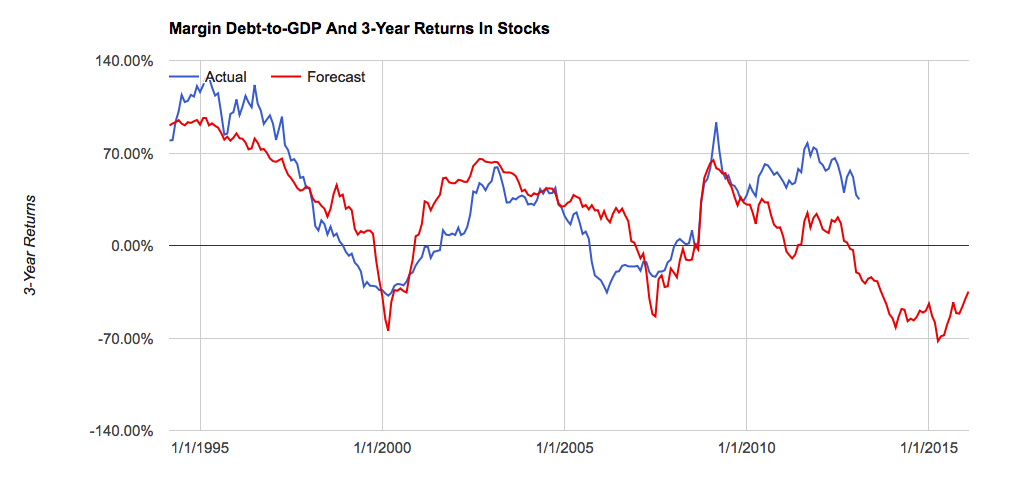
One reason I prefer this measure is that it has a fairly high negative correlation with forward 3-year returns in the stock market. When investors become too greedy, returns over the subsequent 3 years are poor and vice versa. As of the end of February, the latest forecast implied by this measure is for a loss of about 35% over the next three years.

While this measure is pretty good at forecasting 3-year returns that doesn’t help much for investors concerned with the next year or so. In this regard, it may be helpful to observe the trend of margin debt. Where is the nominal level of margin debt relative to its 12-month moving average or simply its level from one year ago? Historically, when these indicators turn negative from such lofty levels, a bear market, as defined by at least a 20% drawdown, is already underway. Right now both of these measure are, in fact, negative.


