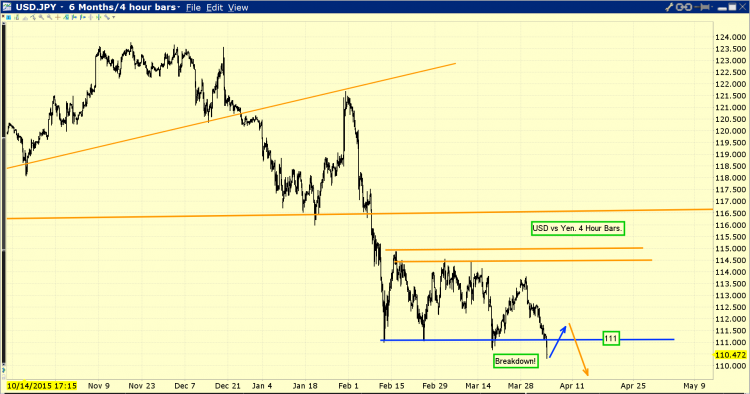
I’ve strongly stated that in the short and intermediate term, the most important price driver of gold is the US dollar’s movement against the yen.
The dollar is the world’s largest “risk-on” market, because America is the world’s largest debtor. Japan is the world’s largest creditor.
Downside action of the dollar against the yen is a financial fire alarm bell. When the alarm rings, many of the world’s most powerful FOREX economists urge their clients to buy gold, and many do with substantial size.
Today is a very exciting day for the entire Western gold community.
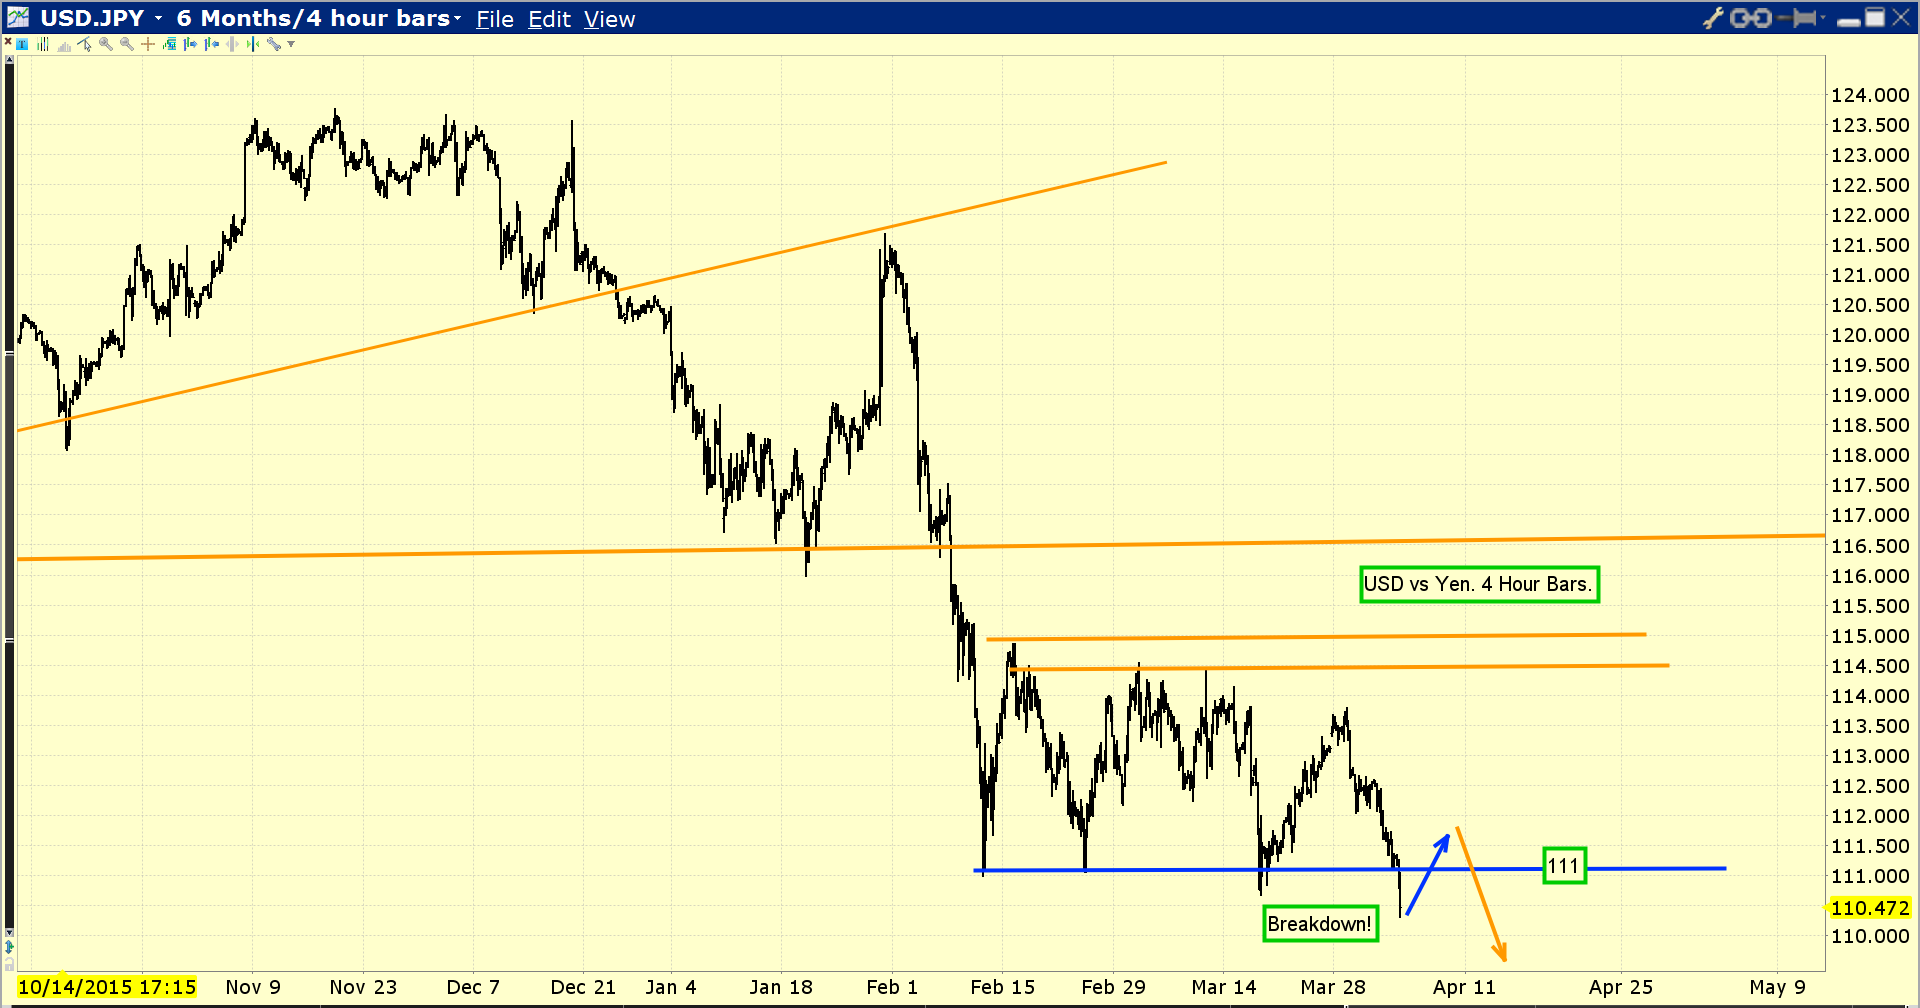
The dollar just broke the key 111 “line in the short term sand” against the yen!
To view the immediate effects of that breakdown on the price of gold.
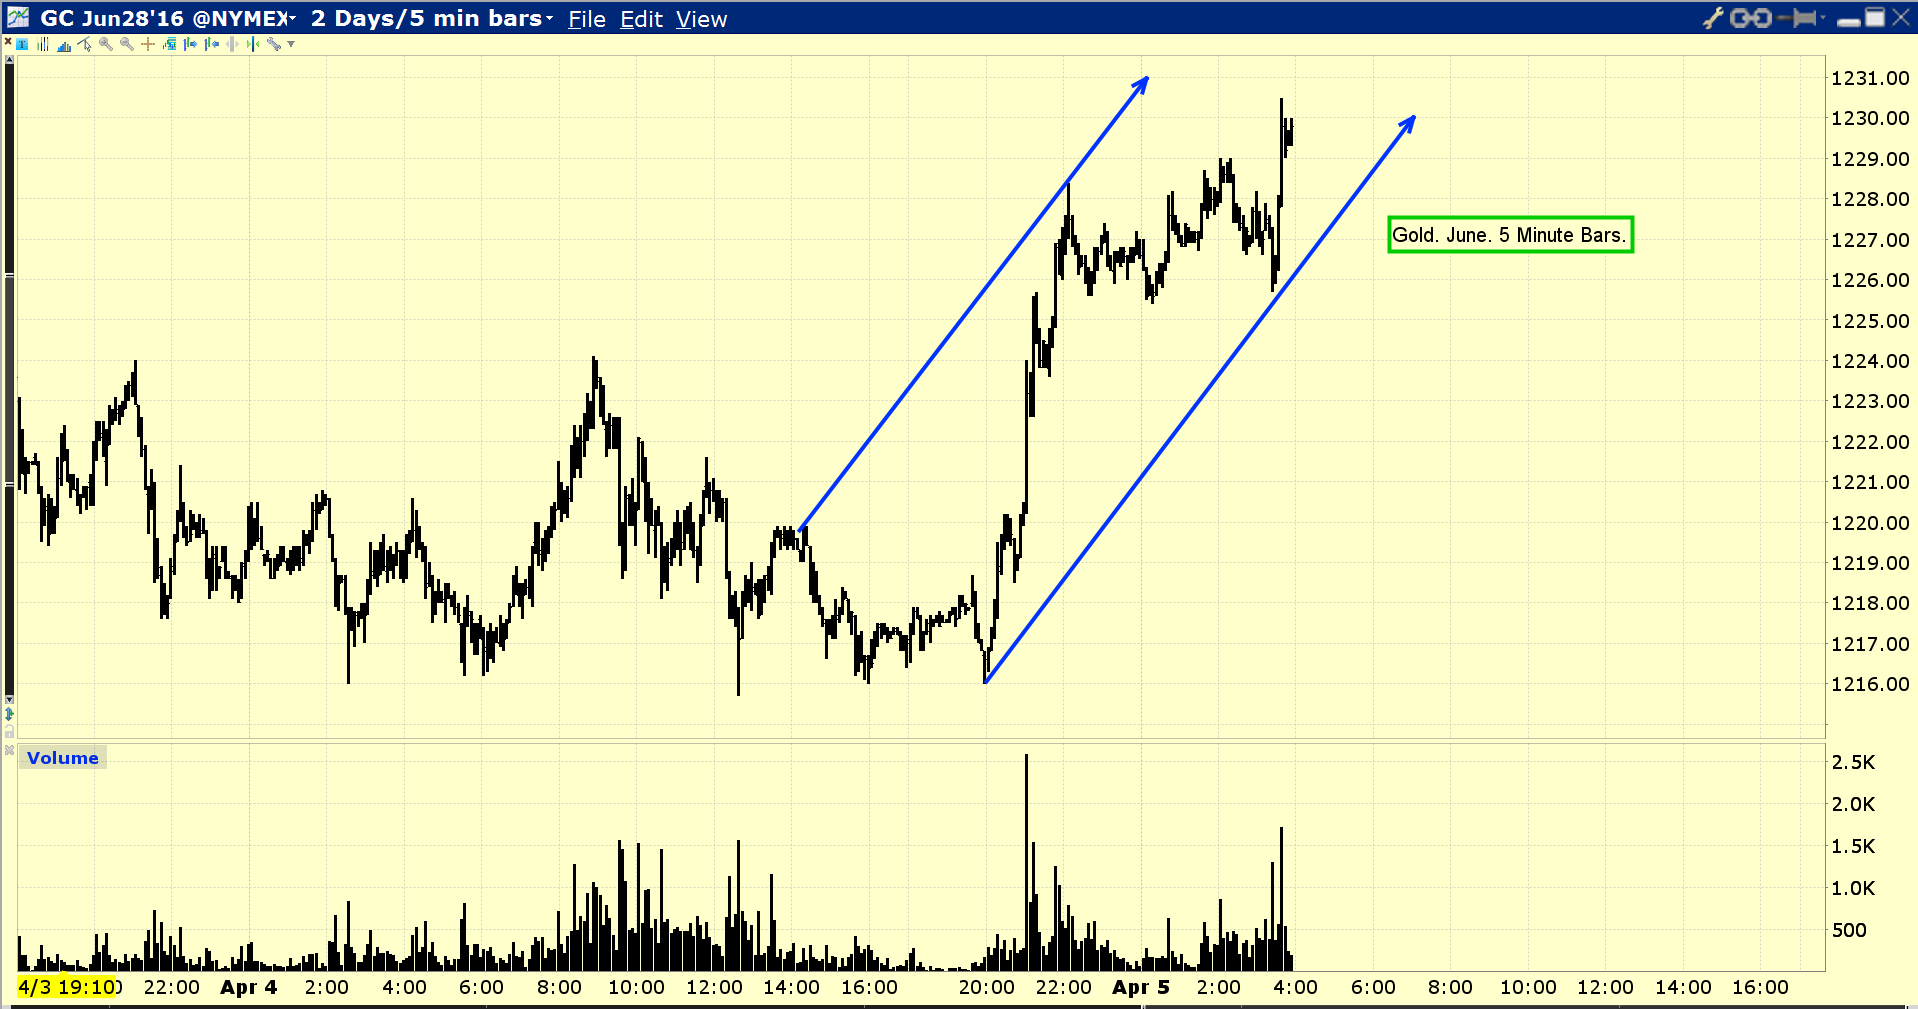
On this short term gold chart, the response of gold to the dollar’s breakdown is very clear.
Gold is like a movie star; supporting actors are needed to put on a great show.
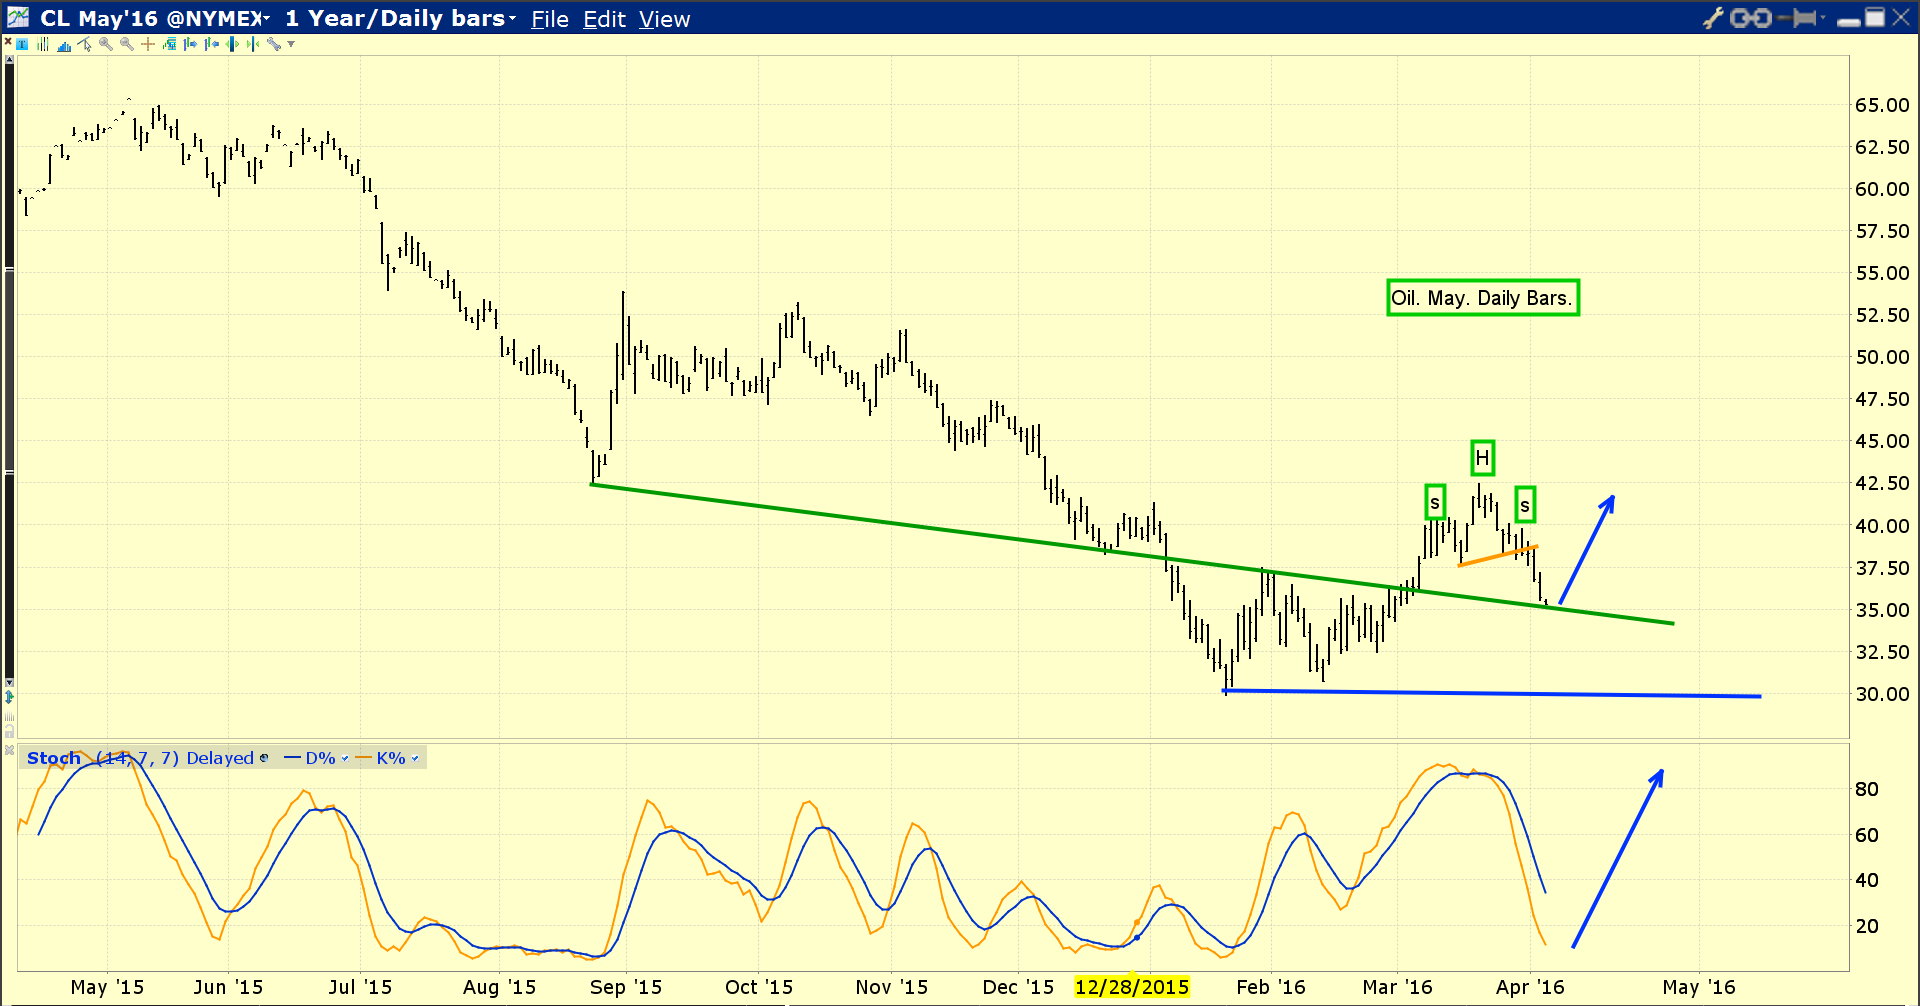
This daily oil chart shows oil arriving at some very interesting chart support, just as gold begins to rally and the dollar versus yen alarm bell rings.
Also, note the position of my 14,7,7 Stochastics series oscillator at the bottom of the chart. A solid buy signal seems to be imminent.
Does the alarm bell being rung by the dollar this morning have an inflationary theme? I think it does.
If oil can rise above the recent highs in the $42.50 area, that’s almost certainly going to generate a new wave of powerful institutional buying in commodity markets.
Sadly, when the dollar alarm bell rings, it can have ominous implications for the US stock market.
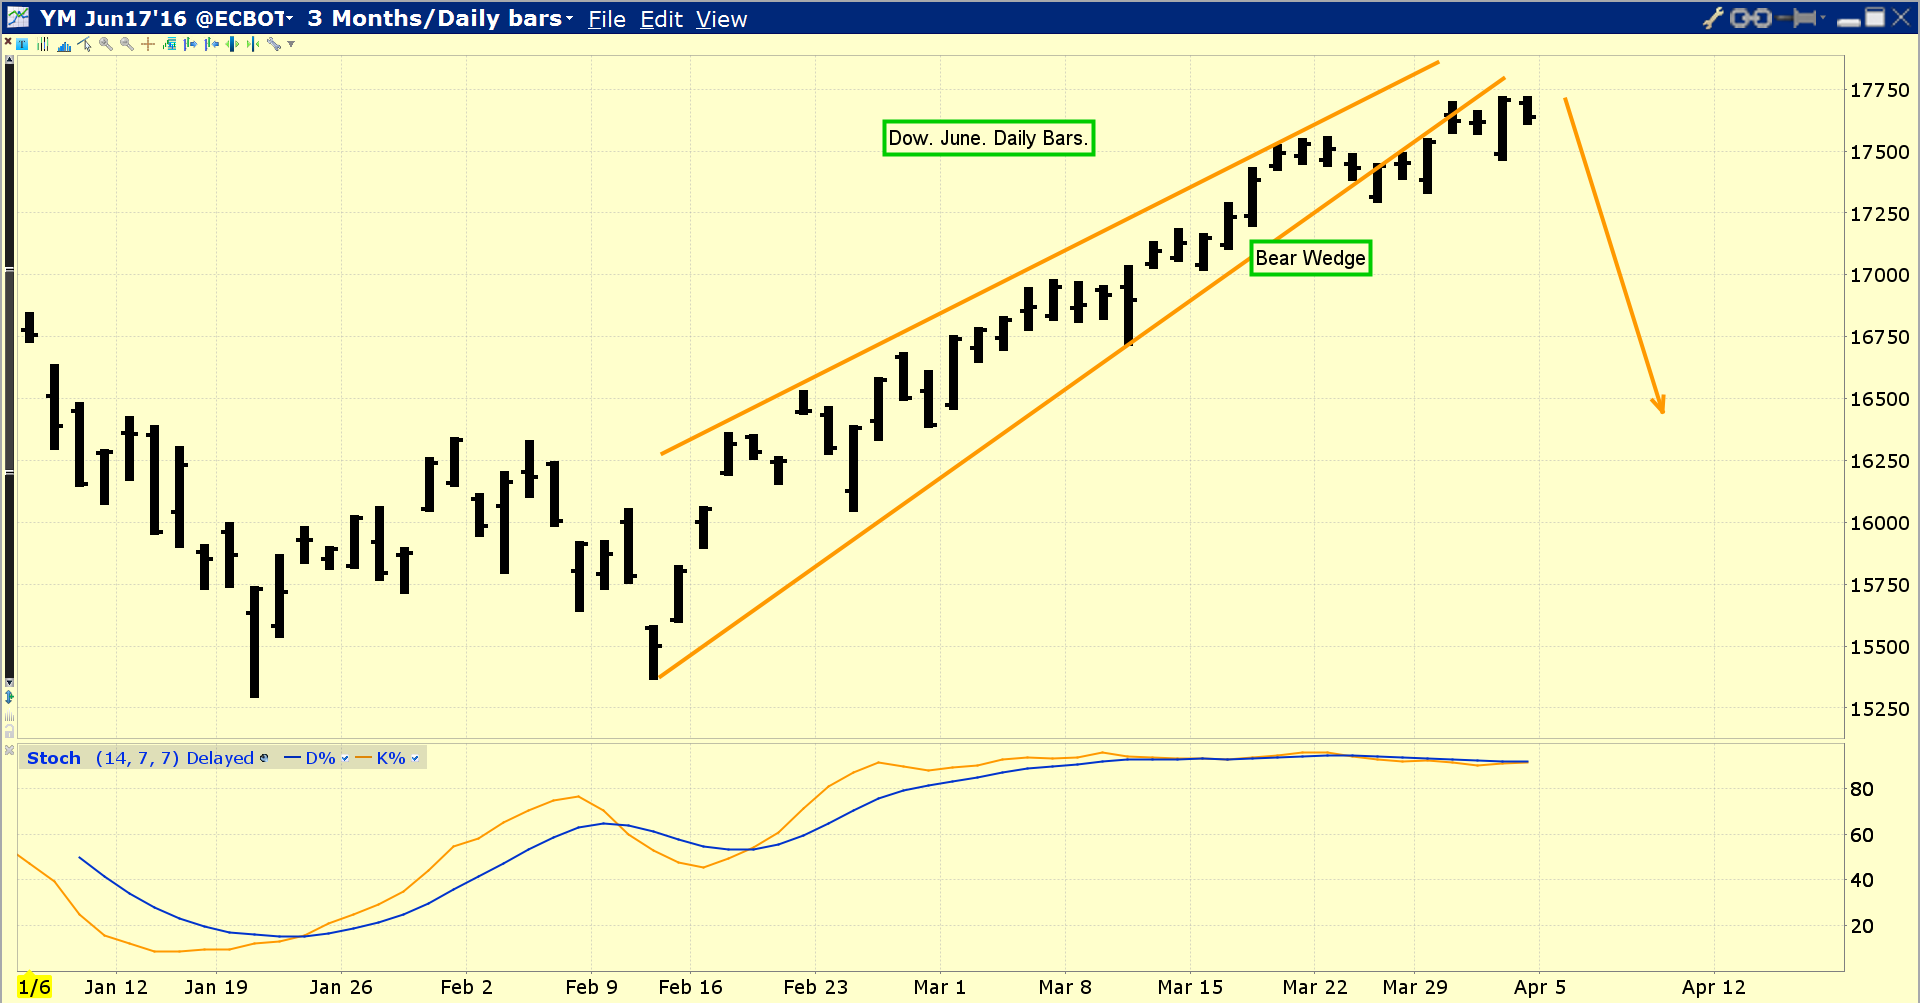
Daily chart of the Dow.
There’s a breakdown from a “bear wedge” pattern in play, and that is occurring as the month of May quickly approaches. The time-tested “Sell in May, and go away” advice may be particularly valuable this year, if Janet Yellen announces a rate hike on April 27.
I’ve argued that rate hikes are very good for gold in the current environment, because of the existence of the massive “QE money ball” sitting at the Fed.
The Fed can theoretically offer the banks a higher interest rate than they can receive by loaning it out in the commercial banking system. That fact is likely irrelevant, because the banks can use the multiplier effect of fractional reserve banking to loan that money out privately, at a ratio of 10 loaned dollars to each deposited dollar. The movement of the QE money ball into the fractional reserve banking system can cause a shocking reversal of money velocity, and a major rise in the rate of inflation.
Mainstream media likes to claim rate hikes are bad for gold. Unfortunately for them, the facts of the $230+ rally that followed Janet’s first rate hike speak vastly louder than their words.
Higher US rates are bad for the Dow, and good for gold. That’s because higher rates in the current environment create a risk-off tidal wave. It’s that simple. Can a second rate hike drive gold another $200 higher, while creating a crash in the Dow, and perhaps a meltdown in US real estate? I think the answer is: Yes.
In the big picture, gold is on the cusp of what I’ve termed a bull era. As famous hedge fund manager Stan Druckenmiller recently noted, America’s population is aging much faster than it is being born. The debt-soaked US government is a giant ball & chain attached to a small and shrinking working class.
The situation is bad, and set to become horrific and fatal, regardless of which politician gets elected. Only gold revaluation can restore the US government’s balance sheet, and I’ve predicted that is probably coming during the next major economic downturn.
At the same time as the American empire dies of old age, the rise of the gargantuan populations of China and India are bringing unprecedented love trade thunder to global gold price discovery. The SGE gold price fix should be launched within about two weeks, and India’s central bank just cut rates, after issuing a statement that a good monsoon season is expected. That means large crops, and lots of money for farmers to buy gold!
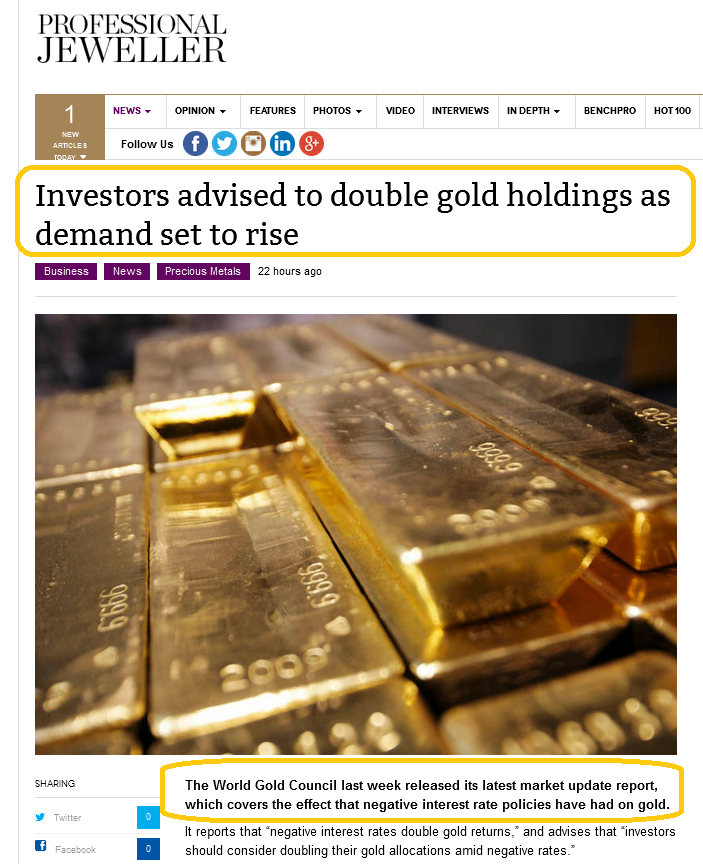
I’ve argued adamantly that negative rates in Europe are as bullish for gold as rate hikes are in America. The Europe situation is different from America, and clearly the WGC (World Gold Council) agrees that investors need to take strong buy-side action.
The bottom line is that gold is the world’s ultimate asset, and there’s never been a more ultimate time to accumulate it in size than right now.
A lot of investors look at the gold versus silver ratio. Rather than looking at that ratio, I think silver enthusiasts should simply watch the US inflation rate.
When powerful US money managers begin talking about a “concerning rise” in the US inflation rate, they will buy silver quite aggressively.
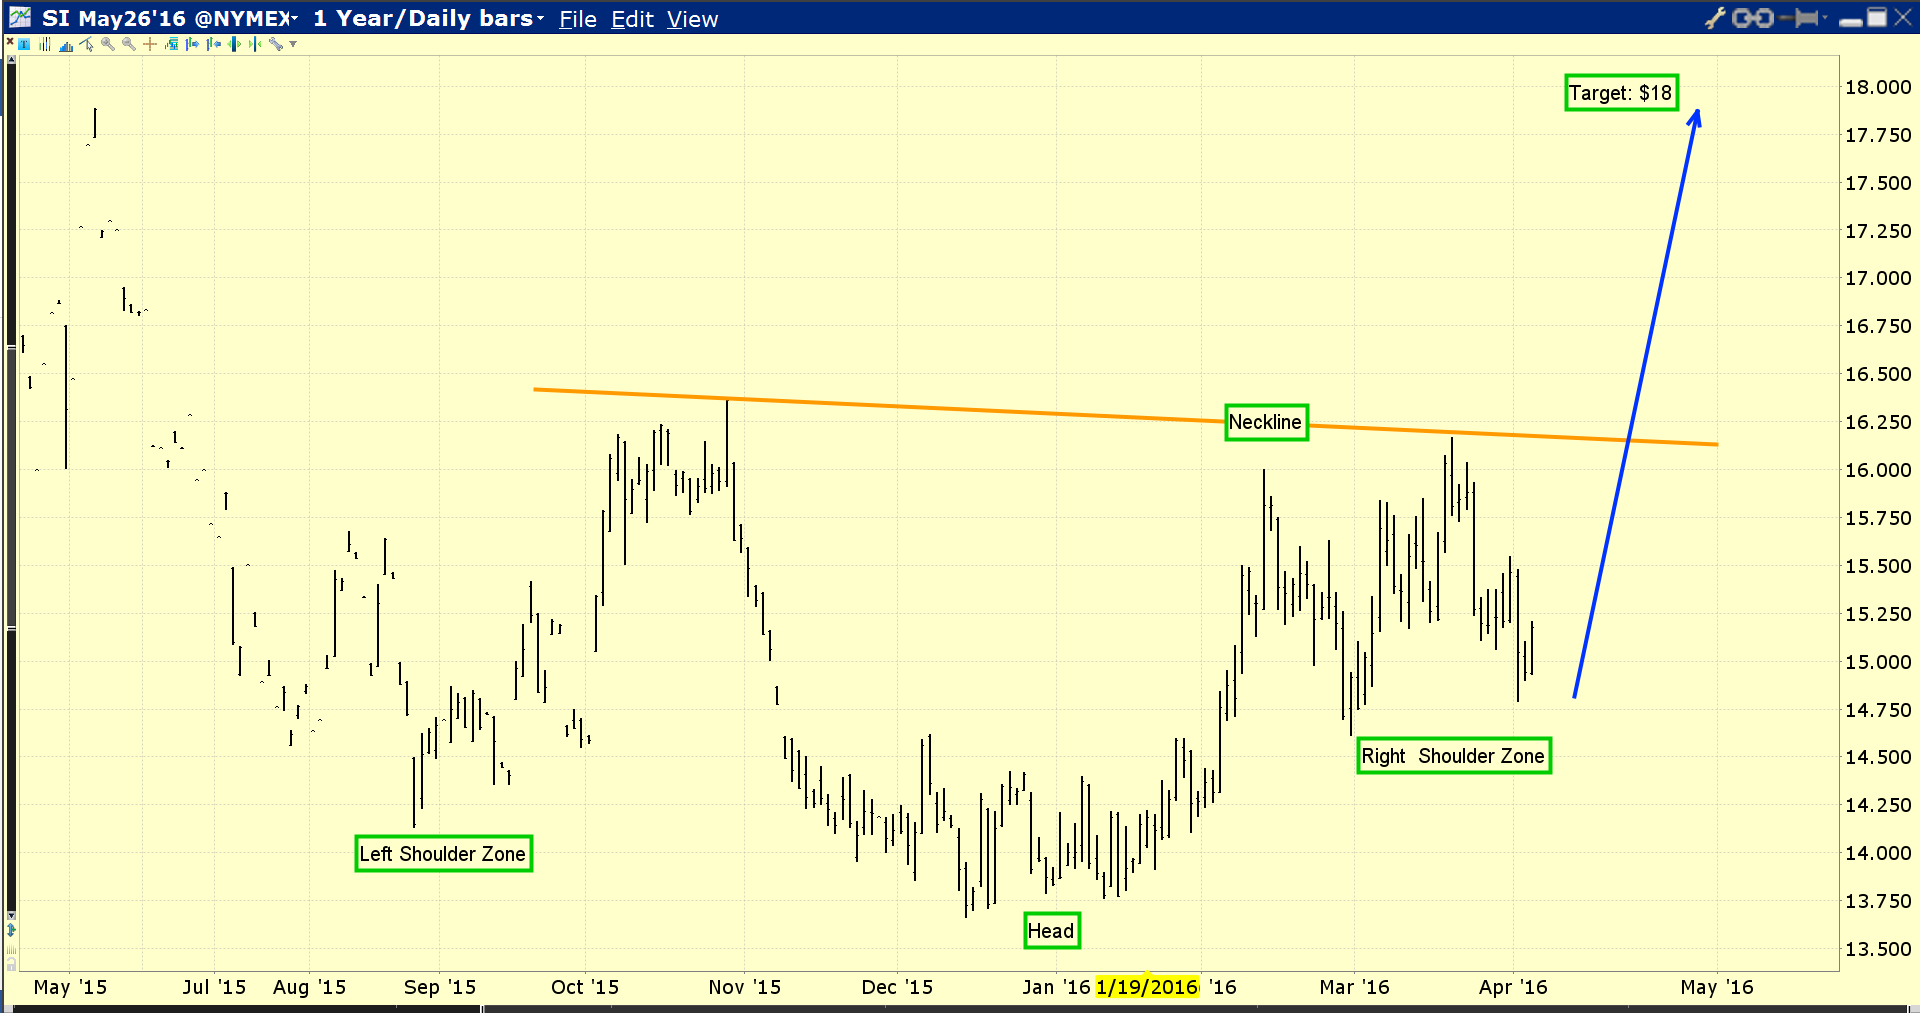
Click to enlarge this fabulous daily silver chart. Silver has a beautiful inverse head and shoulders bottom pattern in play, and the initial price target is $18.
I think it’s a terrible idea to attempt to “micro manage” what are likely generational lows in the price of gold, silver, and associated stocks. Market timers can get destroyed when major value players are buying heavily. What appears to be a top often becomes a simple pause in the upside fun. If ever there was a time for Western gold community investors to “chase price”, with manageable risk, that time is now!
In the case of silver stocks, they are poised to soar.
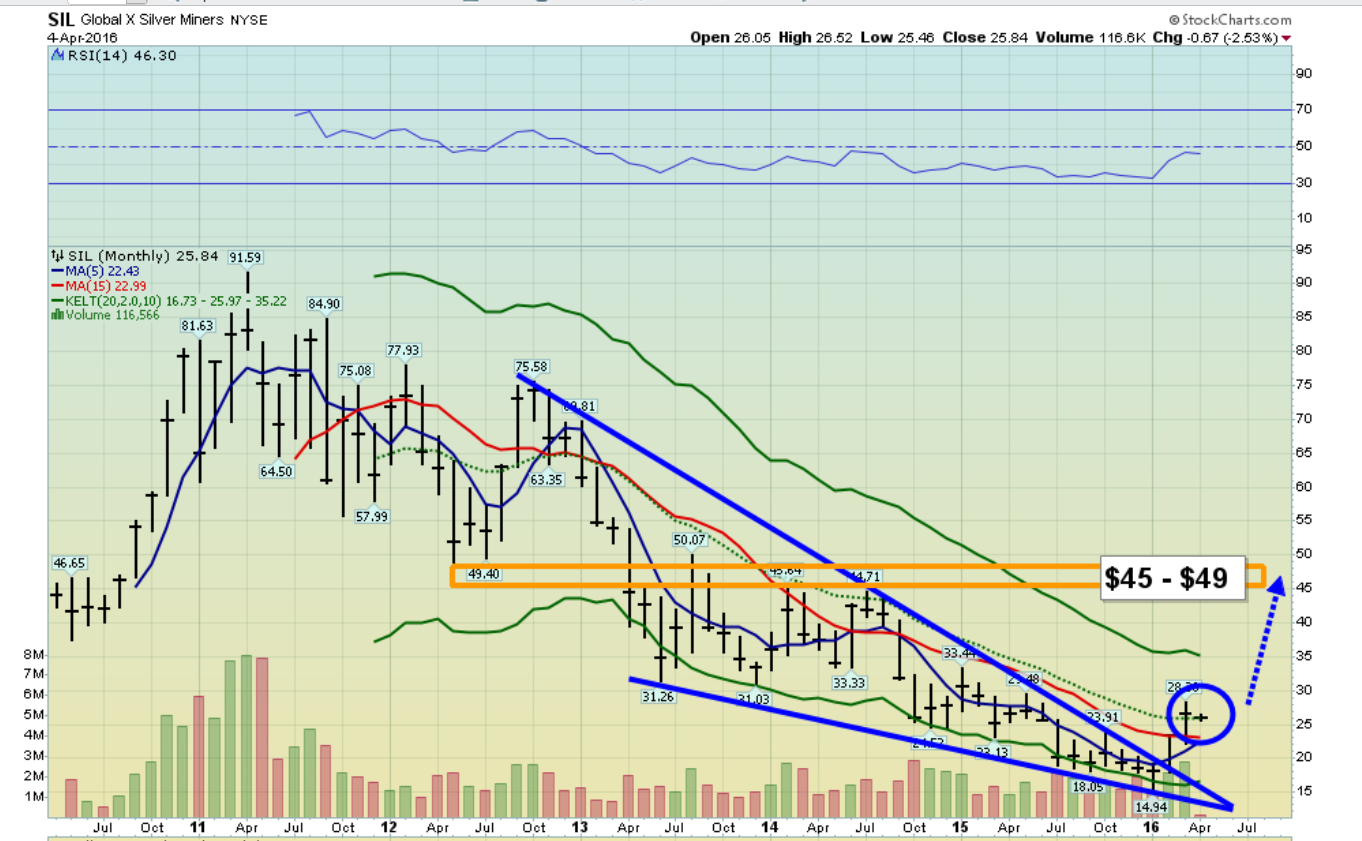
That’s the monthly SIL chart. The technical action is probably best described as, “awesome”. The key 5,15 moving average series is verging on a major buy signal. SIL just rose above the dotted centre Keltner line, which is a momentum-style buy signal. Volume is rising, and there’s a massive bull wedge breakout in play. Against the background of the dollar’s inflationary alarm bell ringing, silver stocks are likely poised to launch what may be the biggest rally seen in any asset class of the past few years!


