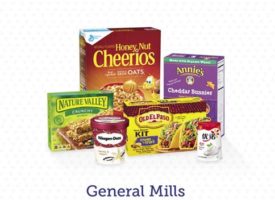

General Mills (GIS) is a blue chip stock that has paid uninterrupted dividends for 117 years. The company’s dividend has increased each year since 2004 and boasts a 10.4% annual growth rate over the last decade.
Despite General Mills’ impressive history, the company’s stock price is down more than 15% since early July 2016 while the S&P 500 Index has gained over 13%.
With investors’ expectations reduced and the stock’s 3.2% dividend yield sitting above its five-year average yield, now is a good time to review why General Mills remains a core holding in our Conservative Retirees dividend portfolio.
Business Overview
General Mills went into business in 1866, owning just a single flour mill at the time. Since then, the company expanded into a number of different industries, including restaurants, toys, and even apparel. However, the company refocused completely on consumer foods in 1995.
Today, General Mills sells a diversified mix of packaged meals, cereal, snacks, baking products, yogurt, and more. The company’s largest brands are Cheerios, Betty Crocker, Yoplait, Pillsbury, Nature Valley, Old El Paso, and Haagen-Dazs. Each of these brands generates over $1 billion in annual sales.
While natural and organic food accounted for about 5% of total revenue last fiscal year, General Mills is the third largest organic food manufacturer in the U.S. and seeks to increase the size of this business to $1 billion by 2019. Growth will be helped in part by continued expansion of its Annie’s brand (acquired in 2014) into new categories.
By product category, cereal accounted for 20% of sales last fiscal year, snacks 19%, yogurt 16%, convenient meals 16%, ice cream 5%, dough 10%, baking mixes 10%, vegetables 3%, and other products contributed 1%.
General Mills primarily sells its products to large retailers such as Wal-Mart (20% of sales), and 72% of its sales last year were made in the U.S. The company has over 600 SKUs per store and has been expanding its product categories organically and via acquisition.
Business Segments
U.S. Retail (61% of sales, 75% of profit): sells meals (24% of U.S Retail sales), cereals (23%), snacks (21%), baking products (19%), and yogurt and other products (13%) to a number of grocery stores, mass merchandisers, dollar stores, natural food chains, and other retailers.
International (28% of sales, 13% of profit): consists of retail and food service business outside of the U.S. The product categories are mostly the same as the U.S. retail business. Europe is the largest region at 43% of International segment sales, followed by Asia Pacific (22%), Canada (20%), and Latin America (15%).
Convenience Stores & Foodservice (11% of sales, 12% of profit): General Mills sells its products in this segment through many channels including food service, convenience stores, vending, and supermarket bakeries.
Business Analysis
General Mills and its predecessors have been around for more than 150 years. Compared to newer companies, General Mills benefits from its scale, long-standing distribution relationships, entrenched brands, and decades of marketing spend.
With almost any consumer product, marketing and product innovation are keys to long-term success.
General Mills can outspend smaller players when it comes to marketing campaigns to ensure its products remain in the forefront of consumers’ minds. General Mills spent more than $750 million last year on advertising and media to protect the brand value of its products.
In addition to customer loyalty, these investments help General Mills more easily pass on input cost increases during years of higher commodity prices.
When you start to add up the total dollars General Mills has invested in marketing over the last several decades, it becomes daunting to think about the challenge new food companies face in winning over consumers to their less familiar brands.
This spending has helped General Mills maintain strong market share positions. Most of the company’s brands hold the number one or number two share positions in their categories and have proven to be very resilient over the years.
In ready-to-eat cereal, General Mills enjoys 30% market share. In refrigerated baked goods and grain snacks, market share positions are even higher at 70% and 40%, respectively.
Many of the company’s core brands have been on the shelves for decades. Cheerios and Nature Valley were introduced in 1941 and 1975, respectively, for example.
Similar to what we noted in our analysis of Kimberly-Clark (KMB), General Mills’ retail customers also have little incentive to try out products from new competitors as long as General Mills’ products are selling well.
According to Nielsen data, a whopping 85% of consumer packaged goods that launch in the U.S. today will fail within two years. It’s no surprise retailers are reluctant to displace mainstay brands.
Given the high failure rate of new products, General Mills’ existing portfolio of successful brands is even more valuable.
The company’s product diversification and financial strength allow it to maintain its lead and continue experimenting. Few companies have the luxury to invest over $220 million in R&D each year like General Mills did during its 2016 fiscal year.
As we pointed out earlier, General Mills is also well diversified by product category, with cereal representing its biggest group at 20% of sales last year.
As consumer trends unexpectedly change, General Mills is somewhat hedged by playing in so many different products. When one category changes directions and requires new R&D and marketing investment, another is likely playing to General Mills’ existing strengths.


