Ok, so this is one of those “dammit, I hate to show the same chart everyone else in the world is showing, but then again, when everyone else in the world is showing it that means I have to” moments.
As you’re no doubt acutely aware, the French elections are the biggest scheduled geopolitical risk event (an example of an “unscheduled” geopolitical event would be: “mushroom cloud on the Korean Peninsula”) and we’ve documented the unfolding drama that is the tense four-way race for the runoff extensively (most recently here).
Well as we and others have noted repeatedly, there are all kinds of indicators flashing bright red in terms of market participants hitting the panic button ahead of Sunday.
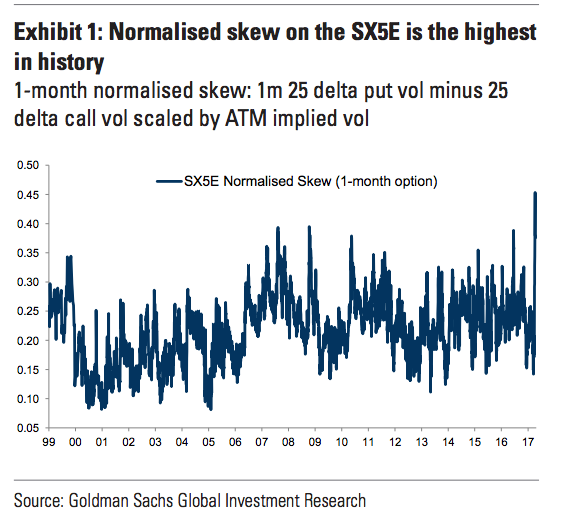
One of those indicators is the skew on the EuroStoxx 50. Here’s the chart followed by some color from Goldman:

European political risk is back in focus as we move closer to the 1st round of the French election. Pricing of French political risk has varied significantly over the last three months and implied volatility is nearly back to elevated levels from February. After peaking at end-February, the VSTOXX April future came down significantly during March but it spiked again in the last two weeks as uncertainty around the 1st election round has increased. This pushed up short-term implied volatility across equities inverting the volatility term structure for the EURO STOXX 50. In Exhibit 1, we plot the normalised skew for the EURO STOXX 50 which represents a measure of expensiveness of puts relative to calls option – it is now higher than during Brexit, the Euro-area crisis and GFC levels which means demand for equity hedges has increased materially relative to supply among investors.


