GBP/USD
4 hour
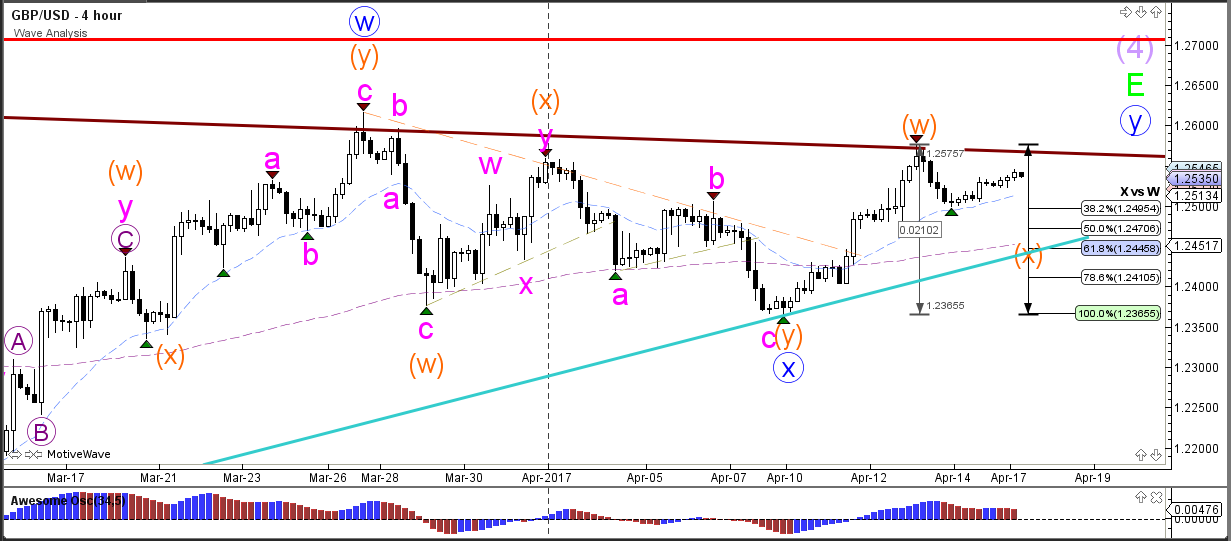
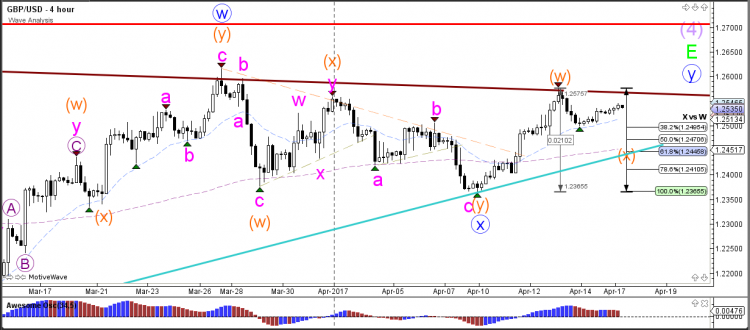
The GBP/USD bearish bounce at resistance (brown) confirmed wave W (orange) and price has retraced back to the 38.2% Fibonacci support level of wave W vs X (orange). Price is moving between support (blue) and resistance (brown) and could be close to completing a chart triangle indicated by wave E (green).
1 hour
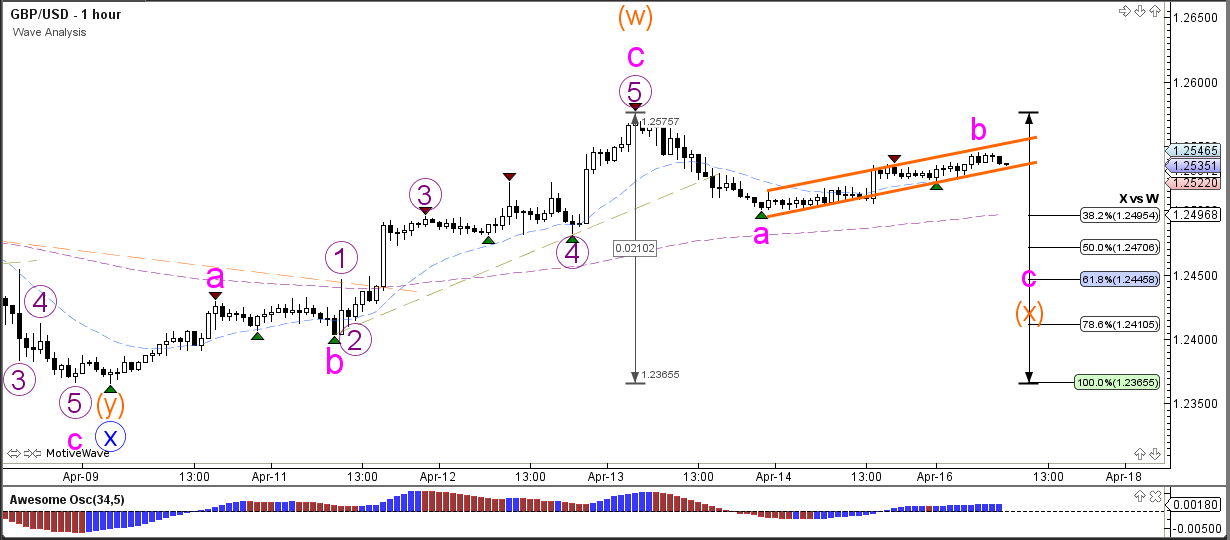
The GBP/USD could extend the wave X (orange) with a new ABC (pink) zigzag that could take price back down to the support trend line (blue). Price would need to break below the bear flag to confirm the correction (orange lines).
EUR/USD
4 hour
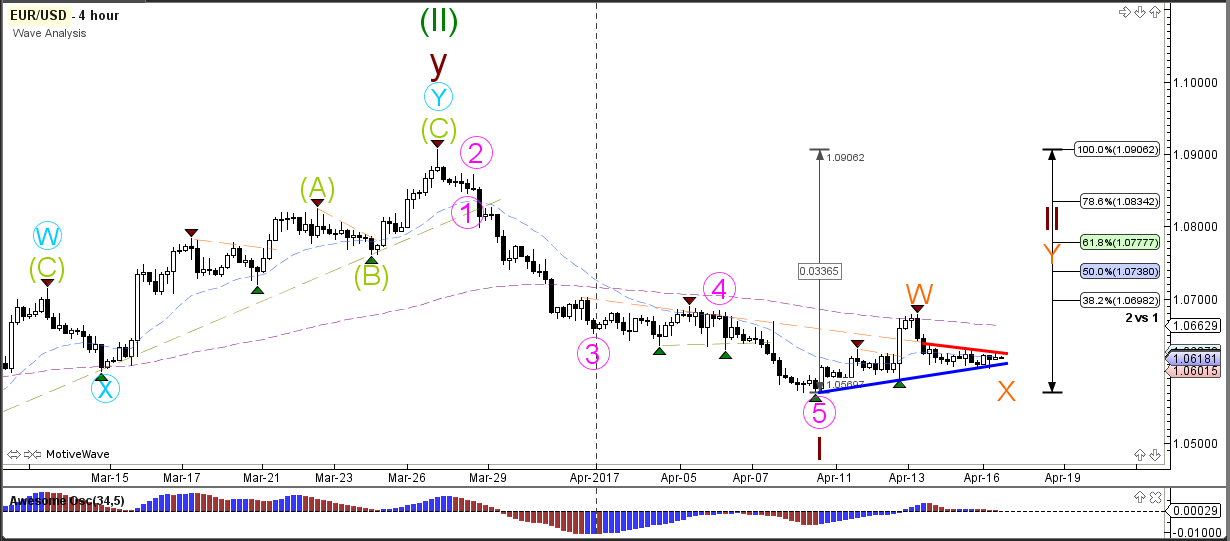
The EUR/USD is challenging the bullish support trend line (blue). A bounce at this level plus break above the smaller resistance line (red) could see a larger retracement within wave 2 vs 1 (green).
1 hour
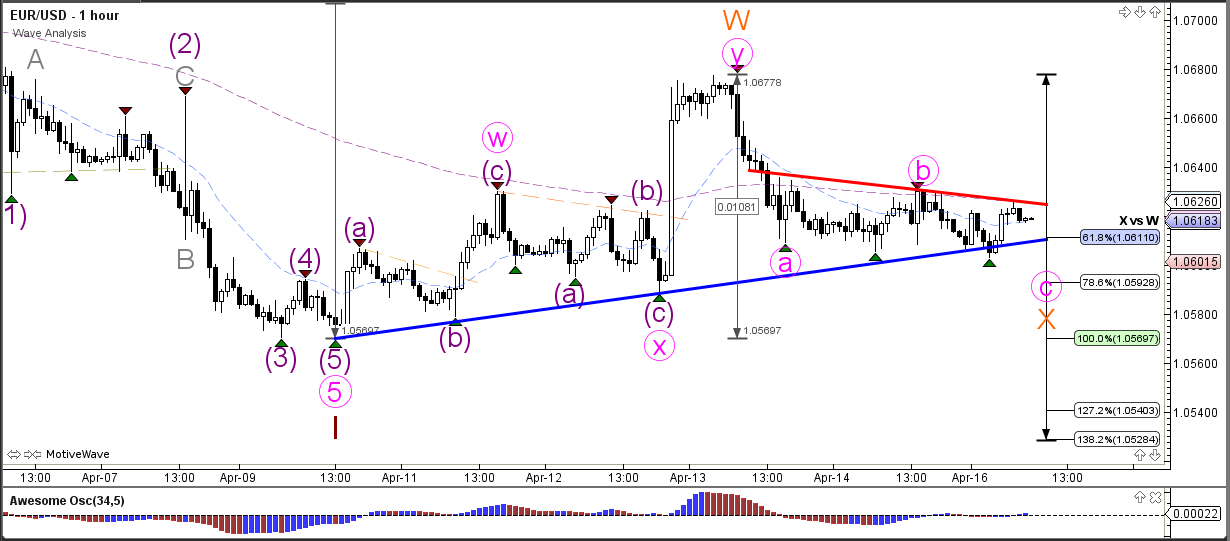
The EUR/USD completed a wave Y (pink) correction, which in turn could lead to a larger WXY (orange) within wave 2 (green). The wave X (orange) stays valid as long as price stays above the 138.2% Fibonacci level of wave X vs W.
USD/JPY
4 hour
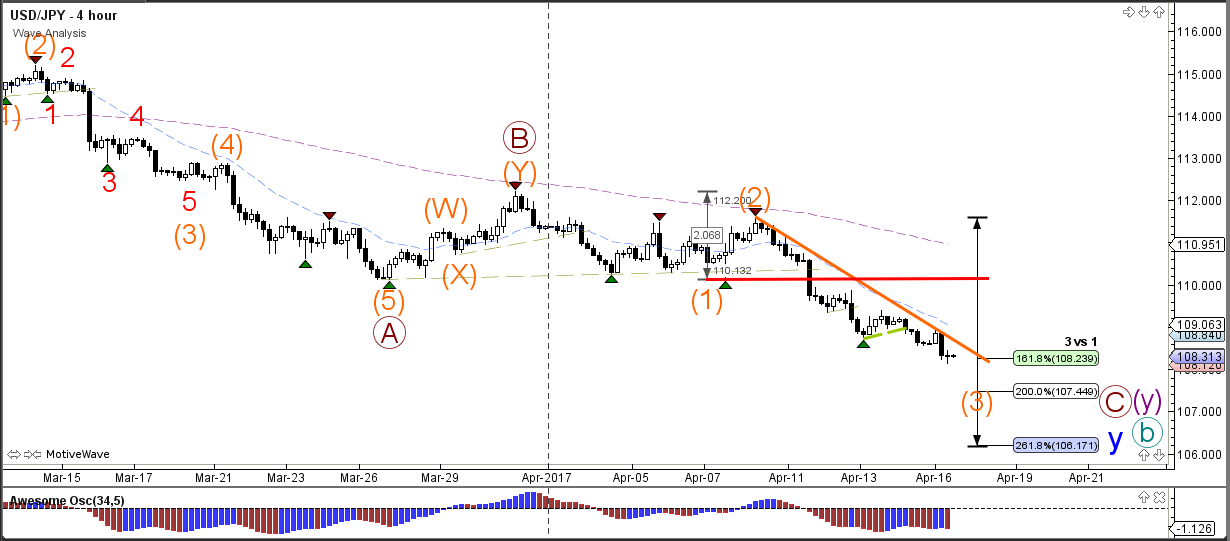
The USD/JPY made a bearish breakout below 108.50 which makes it more likely that price is in a wave B (green). A wave 3 (orange) bearish momentum seems to be taking place as price reaches the 161.8% Fibonacci target. Once the wave 3 has been completed and the potential wave 4 starts, price cannot retrace above the bottom of wave 1 (red line) without invalidating it.
1 hour
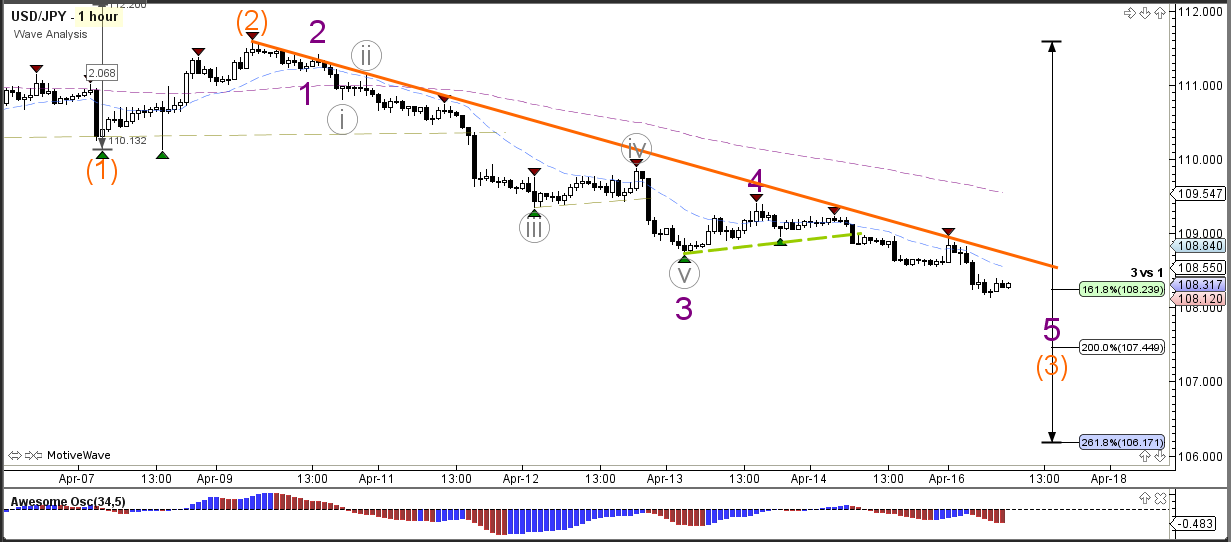
The USD/JPY broke the bear flag (dotted green) chart pattern and seems to be building a wave 5 (purple) within wave 3 (orange).


