Crude oil prices raced higher after official EIA inventory data revealed a far larger outflow than expected. US stockpiles shed 4.73 million barrels compared with the 3.46 million draw expected by the markets and a shock gain foreshadowed in API figures for the same period.
A pause to consolidate may now be in the cards. The stock of top-tier event risk has been exhausted for the week, leaving prices without an obvious catalyst. As ever, the markets’ acute focus on global oversupply means that stray comments from officials in key producing nations may stoke kneejerk volatility.
Meanwhile, a lull in pertinent news-flow left gold prices in digestion mode, as foreshadowed in API figures. All eyes now turn to monetary policy announcements from the BOJ and the ECB, with investors pondering the appeal of non-interest-bearing assets amid increased speculation that normalization is around the corner.
Japan’s central bank seems unlikely to signal stimulus withdrawal and may even dial up dovish rhetoric lest rising yields derail its reflationary ambitions. Mario Draghi and company might foreshadow further tapering of QE asset purchases, which might weigh on the yellow metal.
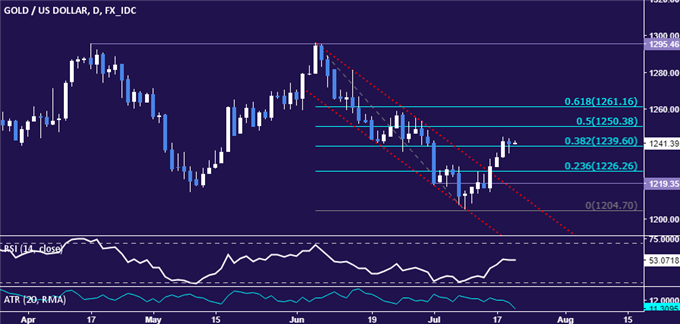
GOLD TECHNICAL ANALYSIS – Gold prices paused to consolidate gains after clearing resistance at 1239.60, the 38.2% Fibonacci retracement. From here, a daily close above the 50% levelat 1250.38 exposes the 61.8% Fib at 1261.16. Alternatively, a turn back below 1239.60 paves the way for a retest of the 23.6% retracement at 1226.26.

Chart created using TradingView
CRUDE OIL TECHNICAL ANALYSIS – Crude oil prices narrowly breached resistance at 47.10, the 38.2% Fibonacci retracement. The break appears to open the door for a test of the 50% level at 48.65, though it bears mentioning that the July 4 swing high at 47.29 continues to hold for now. A reversal back below 47.10 and a falling axis line at 46.63 exposes inflection point support at 45.32.


