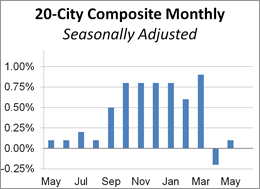
With today’s release of the May S&P/Case-Shiller Home Price Index, we learned that seasonally adjusted home prices for the benchmark 20-city index were up 0.1% month over month. The seasonally adjusted national index year-over-year change has hovered between 4.2% and 5.8% for the last twenty-seven months. Today’s S&P/Case-Shiller National Home Price Index (nominal) reached another new high.

The adjacent column chart illustrates the month-over-month change in the seasonally adjusted 20-city index, which tends to be the most closely watched of the Case-Shiller series. It was up 0.1% from the previous month. The nonseasonally adjusted index was up 5.7% year-over-year.
Investing.com had forecast a 0.3% MoM seasonally adjusted increase and 5.8% YoY nonseasonally adjusted for the 20-city series.
Here is an excerpt of the analysis from today’s Standard & Poor’s press release.
“Home prices continue to climb and outpace both inflation and wages,” says David M. Blitzer, Managing Director and Chairman of the Index Committee at S&P Dow Jones Indices. “Housing is not repeating the bubble period of 2000-2006: price increases vary across the country unlike the earlier period when rising prices were almost universal; the number of homes sold annually is 20% less today than in the earlier period and the months’ supply is declining, not surging. The small supply of homes for sale, at only about four months’ worth, is one cause of rising prices. New home construction, higher than during the recession but still low, is another factor in rising prices.” [Link to source]
The chart below is an overlay of the Case-Shiller 10- and 20-City Composite Indexes along with the national index since 1987, the first year that the 10-City Composite was tracked. Note that the 20-City, which is probably the most closely watched of the three, dates from 2000. We’ve used the seasonally adjusted data for this illustration.


