The Producer Price Index year-over-year inflation marginally declined from 2.4 % to 2.0 %.

Analyst Opinion of Producer Prices
The Producer Price Index is now on a noticeable moderation cycle – with most components declining year-over-year. My only conclusion is that generally there is an overabundance of goods and services – despite the Fed’s insistence the USA is near full employment.
The PPI represents inflation pressure (or lack thereof) that migrates into consumer price.
The producer price inflation breakdown:

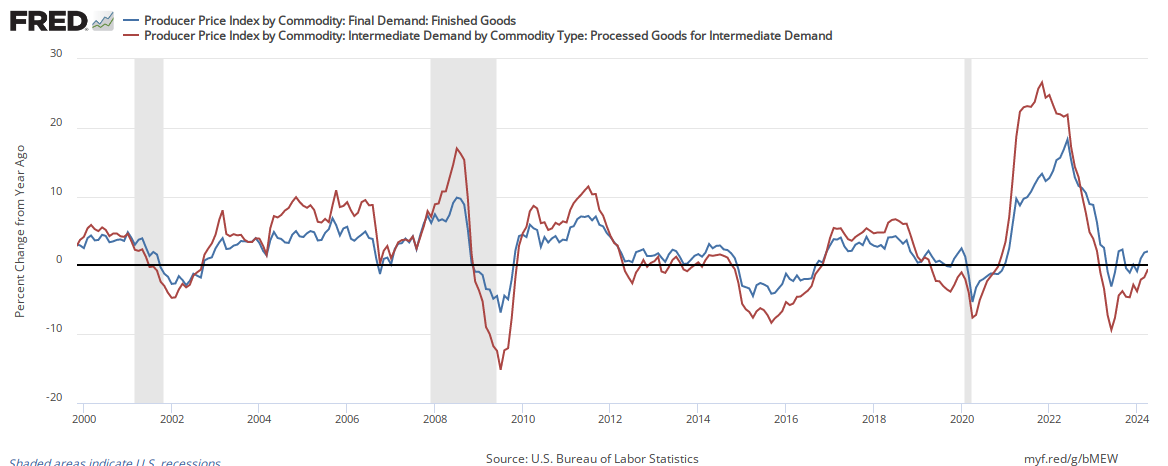
In the following graph, one can see the relationship between the year-over-year change in intermediate goods index and finished goods index. When the crude goods growth falls under finish goods – it usually drags finished goods lower.
Percent Change Year-over-Year – Comparing PPI Finished Goods (blue line) to PPI Intermediate Goods (red line)

Econintersect has shown how pricing change moves from the PPI to the Consumer Price Index (CPI). This YoY change implies that the CPI, should continue to come in around 2.0 % YoY.


