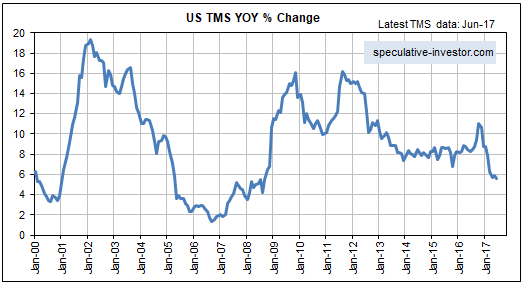
The following monthly chart shows that the year-over-year (YOY) growth rate of US True Money Supply (TMS) made a multi-year peak in late-2016 and has since fallen sharply to an 8-year low. The downward trend in US monetary inflation since late last year has been driven by the commercial banks, meaning that the pace of commercial-bank credit creation has been declining. The Fed, on the other hand, hasn’t yet done anything to tighten US monetary conditions. All the Fed has done to date is edge its targeted interest rates upward in a belated reaction to rising market interest rates.

That the Fed has been tagging along behind the market is evidenced by the following chart comparison of the US 2-year T-Note yield (in blue) and the Effective Fed Funds Rate (in red). The chart shows that a) the 2-year T-Note yield bottomed and began trending upward in the second half of 2011, b) the Effective FFR bottomed and began trending upward in early-2014, and c) the Fed made its first rate hike in December-2015. The market has therefore been pushing the Fed to raise its targeted interest rates for several years.

Interestingly, the Fed has caught up with and is possibly now even a little ahead of the market. This suggests skepticism on the part of the market that economic and/or financial conditions will be conducive to additional Fed rate hikes over the coming few months.
Based on the prices of Fed Funds Futures contracts we know that the market does not expect the Fed to make another rate hike until December at the earliest. This expectation is probably correct. Rather than make an additional ‘baby step’ rate hike there’s a good chance that the Fed’s next move will be to start reducing the size of its balance sheet by not reinvesting all the proceeds from maturing debt securities. Unless the stock market tanks in the meantime, this balance-sheet reduction will probably be announced on 20th September (following the FOMC Meeting) and kick off in October.


