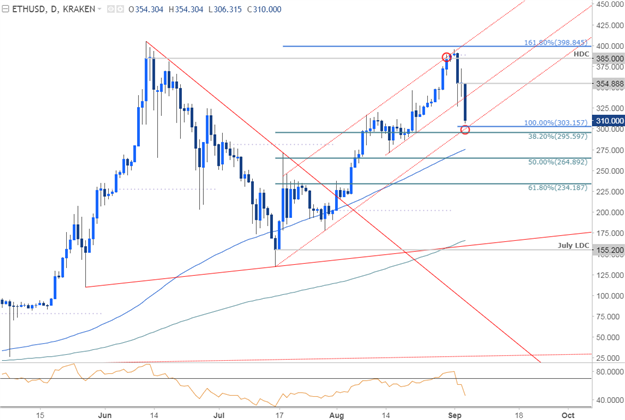
ETH/USD Daily Chart

Technical Outlook: Ethereum prices reversed off slope resistance last week with the decline now approaching in initial support at the confluence of the 100% extension, the 38.2% retracement and the trendline extending off the July lows at 295-303. Heading into the start of the month, the focus will be on this region and price will need to stabilize here if the broader ascending channel structure is to remain viable.
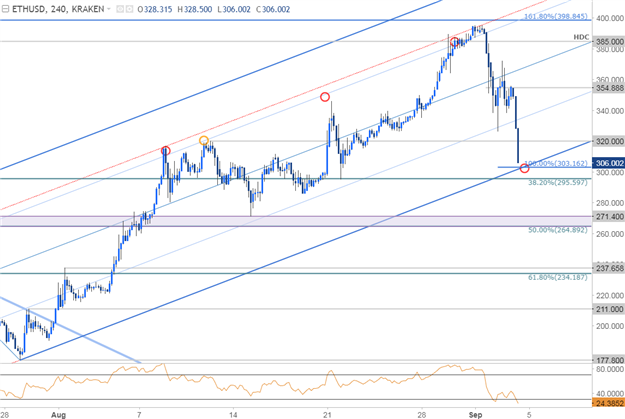
ETH/USD 240min Chart

Notes: Last week we noted Ethereum price targets at, “374 backed by 385– Note that this level also converges on parallel resistance into the close of the month.” Indeed the rally failed to hold above the record high-day close with price registering a high of 395 on September 1st before turning sharply lower.
From a trading standpoint, I’ll be looking for exhaustion into this support zone early in the week with interim resistance eyed at 320 backed by the 50-line (currently ~337) and the 9/2 reversal day close at 354. A close above this level would be needed to give prices a shot at testing the high-day close again at 385.
A break below this region invalidates the broader ascending median-line formation with such a scenario risking a drop into 265/71 and more significant support at 234/37. Bottom line: prices need to stabilize HERE with our near-term focus weighted to the topside while above 295 for now. Keep in mind U.S. markets are offline today in observance of Labor Day and thin liquidity conditions may persist until Asia opens.

—
Relevant Data Releases


