The U.S. Department of Housing and Urban Development suggests that you spend no more than 30% of your annual budget on housing costs as it could put you and your family at greater risk of being unable to afford other necessities. That said, Americans are overachievers.
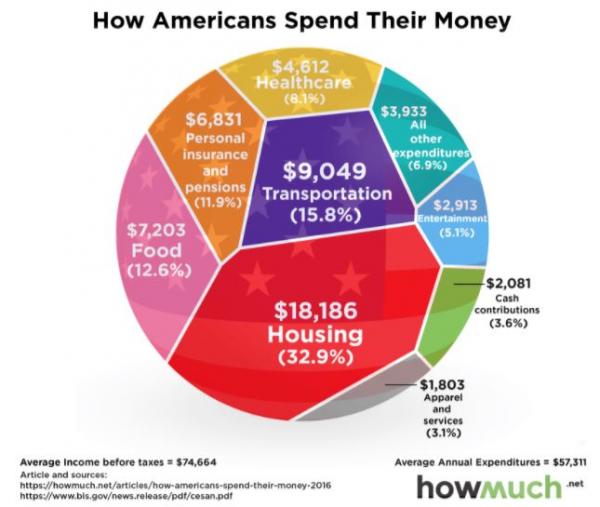
Per the following chart from howmuch.net, the average American family spends roughly $57,000 per year and have thrown caution to the wind with housing costs eating up nearly 33% of annual budgets.In all, some 40 million houses (or about 1/3) are occupied by people who can’t afford them.

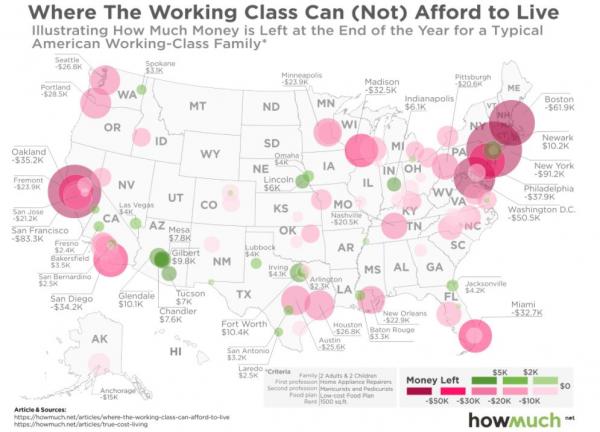
Of course, this is hardly surprising in light of the following chart which reveals that the average working class family can’t afford to live in the majority of metropolitan cities around the country due to ballooning housing costs.

Meanwhile, the following data from Harvard found that over 18 million households are currently stuck spending more than 50% of their annual income on housing, which is up 35% compared to 2001 levels. Per Harvard Study:
The future course of homeownership will also be shaped by how affordable local home prices are for typical renters. On average, 45 percent of renters across the nation’s metropolitan areas can afford the payments on a median-priced home in their market area, but the shares range from less than one in ten in the high-cost markets concentrated on the Pacific Coast as well as in Florida and the Northeast, to two-thirds or more in low-cost metros in the Midwest and rural South. In areas where homebuying is well out of reach for a large majority of renters, there is much less potential for increases in homeownership.
With such large shares of households exceeding the traditional affordability standard, policymakers have increasingly focused their attention on the severely burdened (paying more than 50 percent of their incomes for housing). Although the total number of households with severe burdens also fell somewhat from 19.3 million in 2014 to 18.8 million in 2015, the improvement was again on the owner side (Figure 5). Indeed, 11.1 million renter households were severely cost burdened in 2015, a 3.7 million increase from 2001. By comparison, 7.6 million owners were severely burdened in 2015, up 1.1 million from 2001.
The share of renters with severe burdens varies widely across the nation’s 100 largest metros, ranging from a high of 35.4 percent in Miami to a low of 18.4 percent in El Paso. While most common in high-cost markets, renter cost burdens are also widespread in areas with moderate rents but relatively low incomes. Augusta is a case in point, where the severely cost-burdened share of renters was at 30.3 percent in 2015.


