Crude oil prices sank after Sky News reported that Kurdish Peshmerga militia reached agreement to return to Iraq’s 2003 borders. Conflict between local fighters and government forces in the Kirkuk province shut down two oil fields, stoking supply disruption fears.
The swiftly selloff evaporated as markets looked ahead to API inventory flow data however, and it did not disappoint. The report showed US stockpiles shed 7.13 million barrels last week, outpacing the 3.85 million outflow expected to be on display in EIA statistics due today.
If official figures hew closer to the private-sector estimate, oil prices may enjoy a further boost. JODI numbers on global output and export trends are also due. Commentary from China’s Communist Party Congress as well as the Oil & Money conference are also worth monitoring for relevant tidbits.
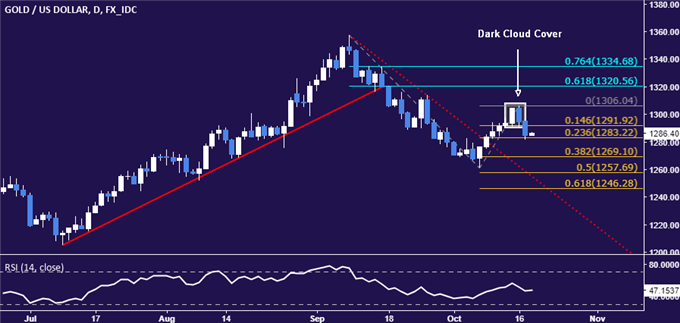
Gold prices continued to fall against a backdrop of rebuilding Fed rate hike speculation. The US central bank’s Beige Book survey of regional economic conditions is now in focus. Signs of firming price growth may help cement the likelihood of tightening in December, hurting the yellow metal further.
GOLD TECHNICAL ANALYSIS – Gold prices declined after putting in a bearish Dark Cloud Cover candlestick pattern, as expected. From here, a daily close below the 23.6% Fibonacci expansion at 1283.22 exposes the 38.2% level at 1269.10. Alternatively, a move back above the 14.6% Fibat 1291.92 opens the door for a retest of the October 16 high at 1306.04.

Chart created using TradingView
CRUDE OIL TECHNICAL ANALYSIS – Crude oil prices are menacing resistance in the 52.83-53.22 area (September 28 high, 38.2% Fibonacci expansion), with a break above that on a daily closing basis targeting the 50% level at 54.49. Alternatively, a turn back below the 23.6% Fib at 51.65 sees the next downside barrier at 50.68, the 14.6% expansion.


