Gold prices rose as the US Dollar pulled back and front-end Treasury bond yields stalled after hitting the highest the level since June 2009. The move appears to be corrective as markets digest two weeks of building Fed rate hike speculation before minutes from September’s FOMC meeting hit the wires tomorrow, offering traders fresh direction cues. Crude oil prices marked time after Friday’s dramatic selloff.
The economic calendar is quiet through the rest of the day and sentiment trends look indecisive, with S&P 500 futures are conspicuously flat ahead of the opening bell on Wall Street. That leaves markets rudderless. That may see gold backtracking lower as investors shy away from picking direction on Fed-related bets before Wednesday’s event risk. Oil may be relegated to familiar territory in the meantime.
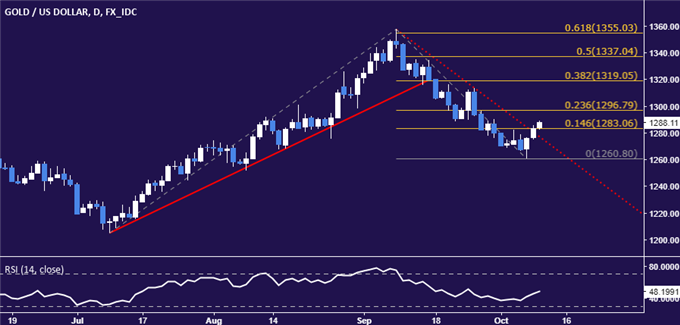
GOLD TECHNICAL ANALYSIS – Gold prices narrowly broke resistance at 1283.06, marked by the 14.6% Fibonacci expansion and a falling trend line guiding the one-month down move. A further daily close above the 23.6% level at 1296.79 exposes the 38.2% Fib at 1319.05. Alternatively, a move back below the trend line – recast as support at 1276.67 – paves the way for a retest of the October 6 low at 1260.80.

Chart created using TradingView
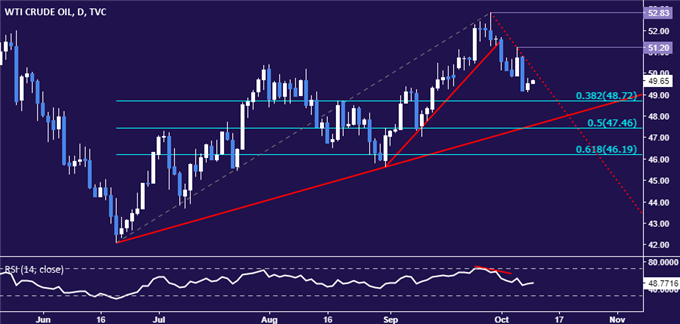
CRUDE OIL TECHNICAL ANALYSIS – Crude oil prices continue to digest losses after suffering the largest one-day drop in a month. From here, a daily close below the 38.2% Fibonacci retracement at 48.72 opens the door for a test of the 50% level at 47.46. Alternatively, a push above falling trend line resistance at 50.18 exposes the October 5 high at 51.20.

Chart created using TradingView


