Stock Market Status
In our August 11 article Potential Pivots Upcoming for Stocks and Gold, we noted several legs that could be kicked out from under the S&P 500’s table in Q4 2017. The stock market blew right through one of them, which was a bearish (on average) seasonal trend for the 2nd half of September. No one indicator is a be all, end all. In sum, they define probabilities. But price is the ultimate arbiter and as of today, price says ‘still bullish’ (says Captain Obvious).
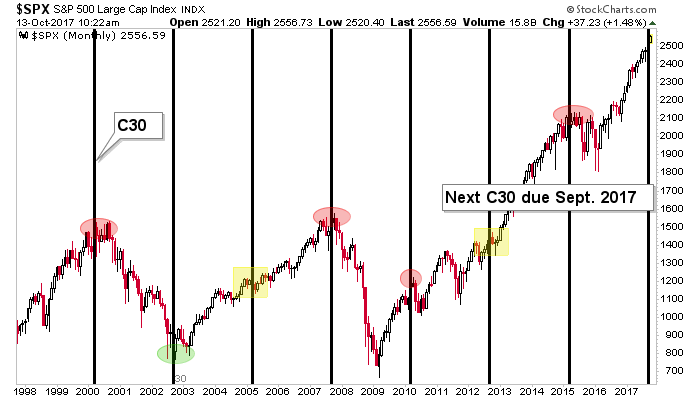
Another leg was the 30 month cycle that has caught 5 of 7 important tops or bottoms (4 tops, 1 bottom) since 2000. As noted when it was first presented, this monthly chart takes into account months of slush in and around the 30 month mark, so it is far from an exact timer. The S&P 500 remains in the window with the September bar now in play.

Another factor was that our measured targets, which we’d plotted when most people were bearish on the market *, had been exceeded. See a post from earlier this week showing more big pictures of US stock indexes and their targets along with global markets, commodities, gold and silver. Most stock market charts shown in the post remain extremely bullish on the big picture (again, Captain Obvious).
As for this chart, targets are never stop signs, but the point is that the bullish measurement is no longer out there in waiting as a bullish factor. It’s long-since in the books.

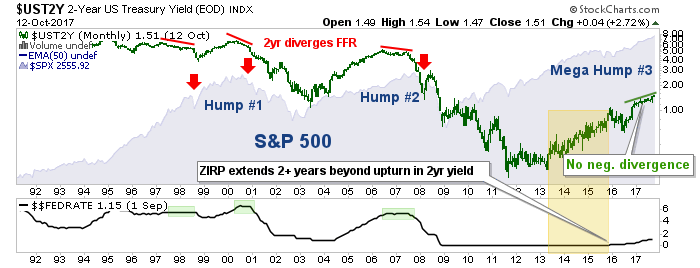
We also noted the Fed’s rate hike cycle, which had gotten underway but was currently not indicating imminent danger. That is still the case, as the Fed Funds Rate is safely below the 2-year yield, which remains in an uptrend (i.e. no negative divergence). It should be well known that the stock market usually continues to climb in the early stages of a Fed rate cycle.

We also noted that several other considerations make up the 4th leg of the S&P 500’s table. Let’s look at a couple of them. We caught the 2014 USD upturn in real time the US dollar index made a higher high in August of that year. That started the clock ticking on a coming bear phase in the US stock market, which would affect multi-national exporters first and foremost. While there was a sharp correction a couple of months later the market did not really roll over until a year after Uncle Buck first turned up.


