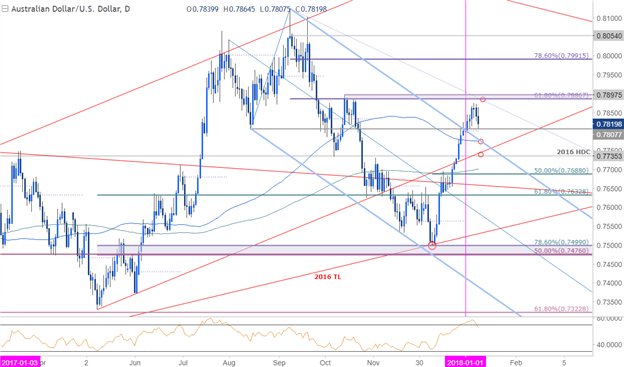
AUD/USD Daily Chart

Technical Outlook: AUD/USD is carving out a well-defined monthly opening range just below a key near-term resistance range at 7887/98– this region is defined by the 61.8% retracement of the September decline & the October swing highs and converges on basic slope resistance extending off the 2017 high.
The immediate advance is at risk while below this threshold near-term and as noted in my Weekly Technical Perspective, “From a trading standpoint, I’m looking lower into the monthly open but ultimately a larger set-back would offer favorable long-entries within this confines of this broader uptrend.”
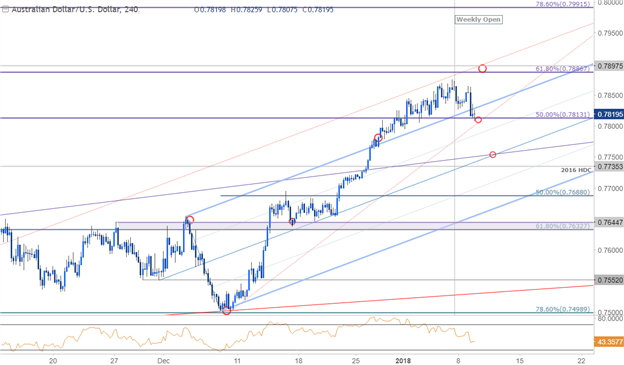
AUD/USD 240min Chart

Notes: A closer look at price action sees Aussie turning just ahead of noted resistance with the pullback now testing interim support here at 7800/13. A break below this levels shifts the focus towards confluence slope support at ~7750s backed by the 2016 high-day close at 7735– both levels of interest for possible exhaustion / long-entries IF reached.
A topside breach of this formation would likely fuel accelerated gains for the pair with such a scenario targeting subsequent resistance objectives at 7991 and the 2017 high-day close at 8054. Bottom line: the immediate focus is on a break of the 7800-7898 range for guidance with a move lower to ultimately offer more favorable long-entries. Note that the economic docket is rather quiet until the tail end of the week with the U.S. Consumer Price Index (CPI) and Retail Sales on tap.


