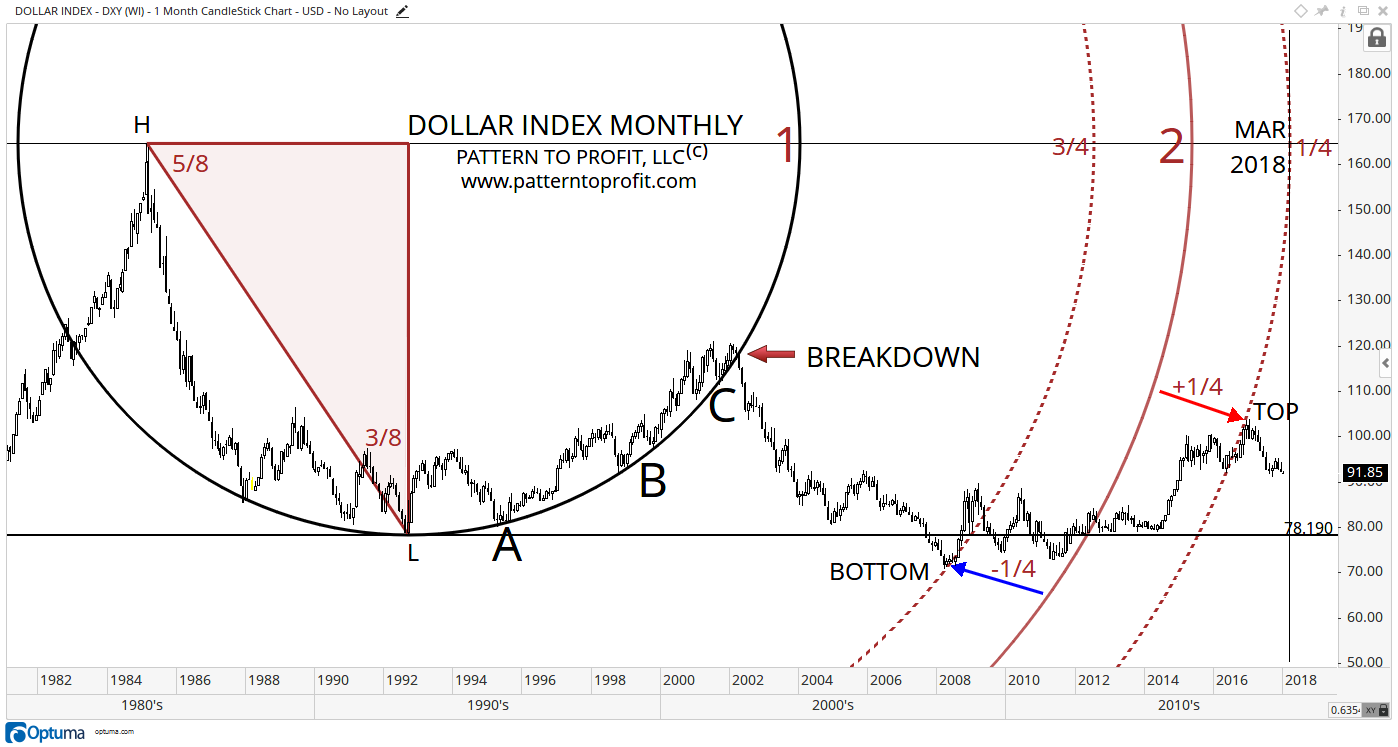
As indicated in our September 7, 2017 article a major bear market would be underway with a successful breakdown of major circular support. Such activity would be seen as a repeat of the breakdown that occurred on April 2002. Here’s the 2002 time period for comparison:

Also note the bottom and top formations at concentric circles 1¾ and 2¼ (brown dashed) respectively. They identify the finality of this large correction to the apparently prevailing major downtrend.
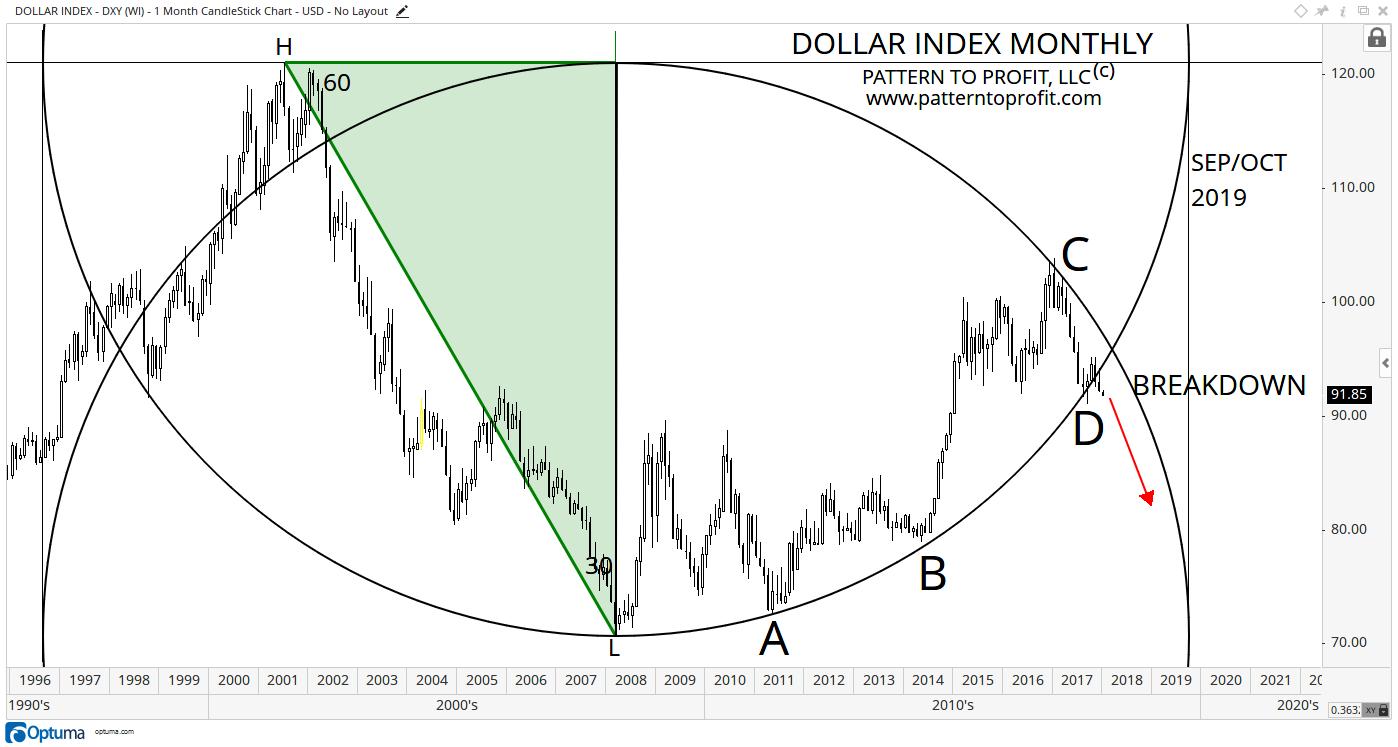
Now compare this April 2002 breakdown of circular support to the updated chart below showing a new breakdown:

Here is a close-up, featuring the markets’ specific interactions with support:

While the rally of September and October 2017 was an admirable attempt to move off circular support as those months each closed above circular support (consecutive white candles), unfortunately for the dollar, the following months of November and December were decisive to the downside:
In conclusion, the US dollar is expected to return to the much larger downtrend.


