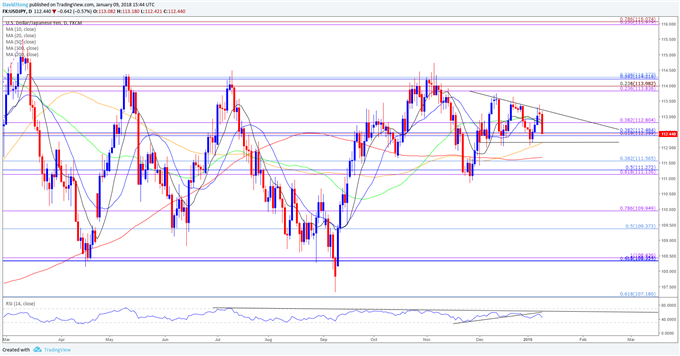

USD/JPY struggles to preserve the advance from the beginning of the year as the Bank of Japan (BoJ) reduced its purchases of long-term bonds under its Quantitative/Qualitative Easing (QQE) Program with Yield-Curve Control, and the pair stands at risk of threatening the range-bound price action from December should a growing number of Fed officials adopt a cautious outlook for the U.S. economy.
With little details accompanying the BoJ announcement, the adjustment in the asset-purchase program may be a one-off event as inflation runs well below the 2% target, and fresh comments coming out of the Federal Reserve may ultimately sway the dollar-yen exchange rate as Minneapolis Fed President Neel Kashkari, Chicago Fed President Charles Evans, Dallas Fed President Robert Kaplan, St. Louis Fed President James Bullard, New York Fed President William Dudley, Philadelphia Fed President Patrick Harker and Boston Fed President Eric Rosengren are all scheduled to speak over the coming days.
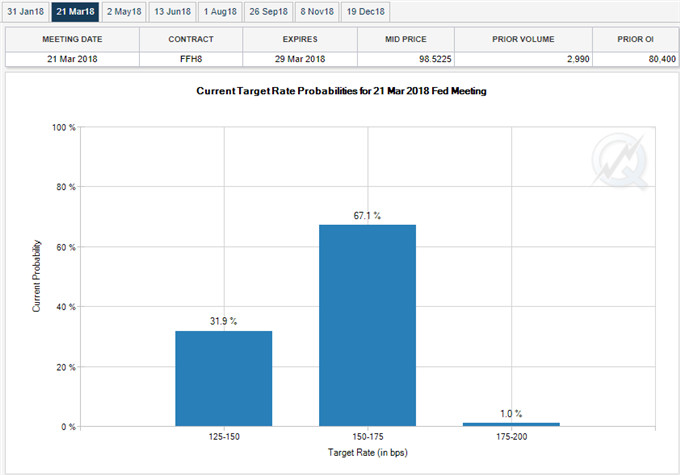
Even though Fed Fund Futures highlight a greater than 60% probability for a March rate-hike, lackluster data prints coming out of the U.S. economy may encourage a growing number of central bank officials to strike a cautious tone as ‘some participants observed that there was a possibility that inflation might stay below the objective for longer than they currently expected.’ In turn, a slew of dovish rhetoric may generate a bearish reaction in USD/JPY, with the exchange rate at risk of falling back towards the bottom of its current range as market participants scale back bets for three Fed rate-hikes in 2018.
USD/JPY Daily Chart