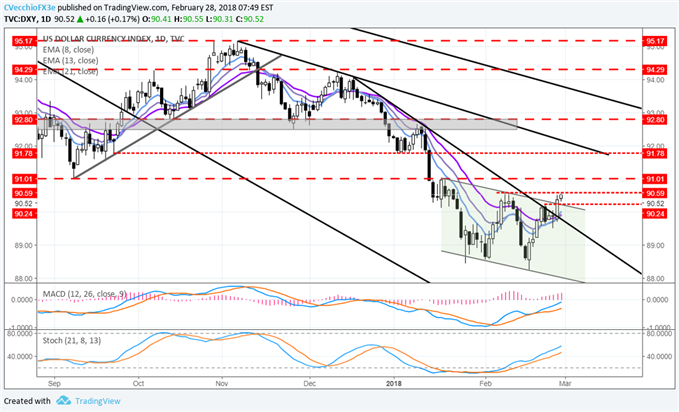
The US Dollar (via DXY Index), sparked by new Fed Chair Jerome Powell’s testimony, has showed signs of finally emerging from a potential bottom. Price closed above two key trend levels yesterday: the downtrend from the December 18, January 11, and now February 21 highs; as well as the descending channel top off of the January 17 and February 8 highs.
Price Chart 1: DXY Index Daily Timeframe (August 2017 to February 2018)

While this may mean that a broad USD-bearish bias is no longer applicable, we’re still of the mindset that a true bottom can’t be called until the DXY Index clears out 91.01, the former 2017 low and swing highs from mid-January.
In turn, it’s best to look at USD-pairs on a case-by-case basis if we are no longer applying a bearish bias in broad strokes. In particular, we’re going to want to keep an eye on EUR/USD, which constitutes 57.6% of the DXY Index. A close through 91.01 in DXY, where there was a failed morning doji star candle cluster between January 15-17, corresponds with a move below 1.2365 in EUR/USD, where there was a failed evening doji start candle cluster during that same period in mid-January.
One currency sticks out among the rest, however, given price action yesterday and during the month of February, generally: the Japanese Yen. The prospect of tighter Fed monetary policy proved to be a negative development for higher yielding currencies and risk-correlated assets. Notably, AUD/JPY and CAD/JPY continue to trade lower against their daily 8-EMAs, while EUR/JPY has broken significant support dating back to September.
See the video for technical considerations in the DXY Index, EUR/USD, USD/CHF, USD/CAD, AUD/JPY, CAD/JPY, and EUR/JPY.


