The headlines say the durable goods new orders and backlog improved. However, the unadjusted three month rolling average declined.

Analyst Opinion of the Durable Goods Situation
Civilian and defence aircraft were the main tailwind this month. This series has wide swings monthly so our primary metric is the unadjusted three month rolling average which marginally declined. I consider this a weaker report than what is observed at first glance.
Econintersect Analysis:
unadjusted new orders growth accelerated 0.2% (after decelerating 0.7 % the previous month) month-over-month , and is up 9.1 % year-over-year.
the three month rolling average for unadjusted new orders decelerated 0.1 % month-over-month, and up 9.3 % year-over-year.
Year-over-Year Change of 3 Month Rolling Average – Unadjusted (blue line) and Inflation Adjusted (red line)

z durable1.png
Inflation adjusted but otherwise unadjusted new orders are up 7.9 % year-over-year.
Backlog (unfilled orders) improved 0.3 % month-over-month, and is up 2.3 % year-over-year.
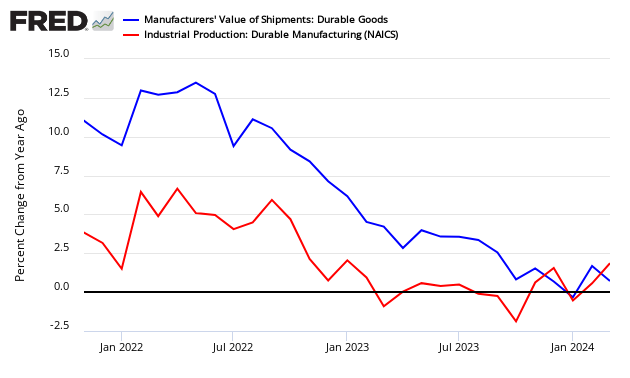
The Federal Reserve’s Durable Goods Industrial Production Index (seasonally adjusted) growth up 0.2 % month-over-month, up 3.0 % year-over-year [note that this is a series with moderate backward revision – and it uses production as a pulse point (not new orders or shipments)] – three month trend is accelerating.
Comparing Seasonally Adjusted Durable Goods Shipments (blue line) to Industrial Production Durable Goods (red line)

note this is labelled as an advance report – however, backward revisions historically are relatively slight.
Census Headlines:
new orders increased 3.1 % month-over-month.
backlog (unfilled orders) improved 0.2 % month-over-month.
the market expected (from Bloomberg/Econoday):
| |
Consensus Range |
Consensus |
Actual |
| New Orders – M/M change |
0.7 % to 2.7 % |
+1.7 % |
3.1 % |
| Ex-transportation – M/M |
0.1 % to 1.3 % |
+0.6 % |
+1.2 % |
| Core capital goods – M/M change |
0.2 % to 1.0 % |
+0.6 % |
+1.8 % |


