US EQUITY SLUMP CONTINUES
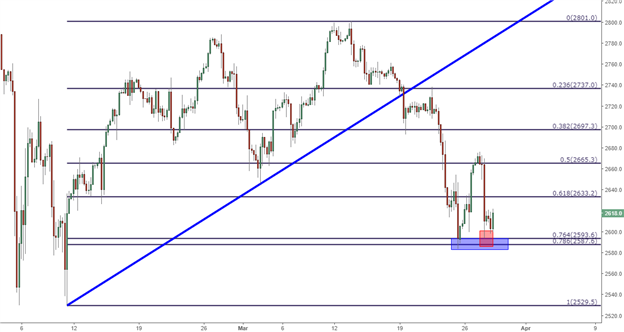
The big item over the past 24 hours is another bearish move in US equities. Yesterday’s late-session sell-off reversed the entirety of Monday’s gains, and the sell-off ran all the way until the 76.4% Fibonacci retracement of the February-March move came into play around 2594. This was the same zone of prices that had helped to set support on Friday, which led into the Monday rally. The big question at this point is whether this support can hold as we move towards the end of Q1.
S&P 500 FOUR-HOUR CHART: FIBONACCI SUPPORT CATCHES THE LOWS

Chart prepared by James Stanley
FACEBOOK SELL-OFF RISKS CHANNEL BREAK
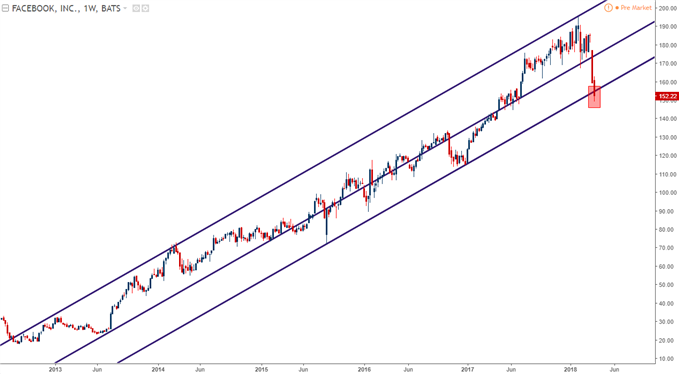
The big item in the headline that’s being attributed to this equity sell-off is the carnage that’s been showing in FANG stocks. That’s Facebook, Amazon, Netflix and Google; with the sell-off being led by Facebook around privacy concerns, and this is also hitting Google’s stock as prices have pulled back to test the psychological $1,000 level. This week’s price action has brought a rather aggressive bearish response, and at this point FB is risking a close below a trend-line that’s never been broken. This can be found by connecting the August 2015 low to the January 2017 low. This trend-line runs parallel to a couple of others that help to compose a channel, but with Facebook’s down-side break, if confirmed by a weekly close below this area – the door is opened to considerably more selling.
FACEBOOK (FB) WEEKLY CHART: TESTING SUPPORT SIDE OF LONG-TERM BULLISH CHANNEL

Chart prepared by James Stanley
DOLLAR BULLS TAKE THEIR SHOT
For all the excitement in the equity space, currencies have been relatively benign over the past 24 hours. Yesterday, we had looked at the US Dollar testing resistance at a prior area of support, right around the previous March lows. That resistance held through the US session and through most of Asia, at which point a higher-low began to show as prices moved back into that zone.


