US DOLLAR KICKS OFF THE WEEK BY RUNNING BACK TO SUPPORT
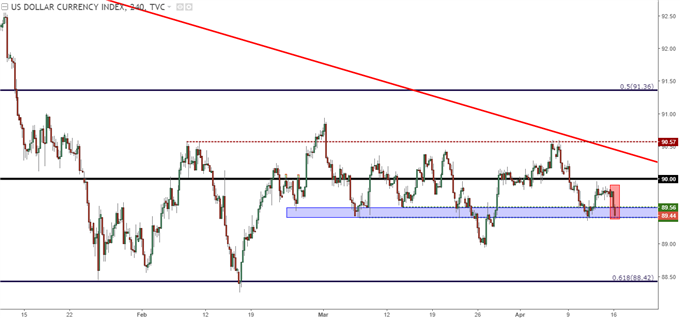
Last week saw near-term Dollar weakness continue after the disappointing NFP report from the Friday before. DXY made a late-week attempt to re-test the 90.00 level, but even that fell flat as sellers came in ahead of that potential resistance. As we open up a fresh week, the Greenback has run right back to the support zone from last week, and this is the same area that held the lows in DXY for the bulk of March.
US DOLLAR VIA ‘DXY’ FOUR-HOUR CHART: LAST WEEK’S STRENGTH RUNS SHORT OF 90.00, BACK TO SUPPORT

Chart prepared by James Stanley
US DOLLAR RANGE APPEARS SET TO CONTINUE
The US Dollar has now been range-bound for two-and-a-half months. Prices ran-lower through the first few weeks of 2018, hitting a key area of Fibonacci support, and after another test of that level in February, price action has continued to oscillate back-and-forth with range-like behavior. This move is related to the range that we’ve seen in EUR/USD, and given that DXY is comprised of a 57.6% allocation to the single currency, this relationship makes sense. As long as we see the range in the US Dollar continue, we’ll likely be seeing some element of range-bound price action showing in EUR/USD.
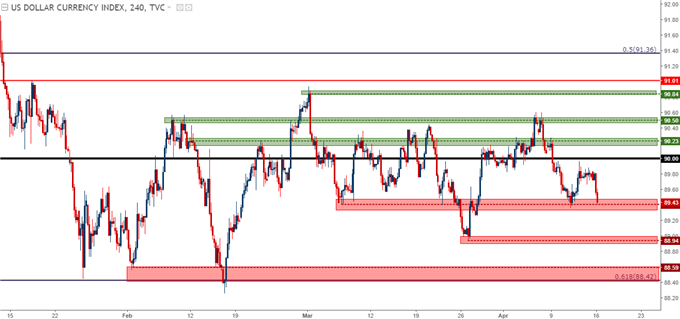
If support does not hold in the current zone, there are two areas below current price action that would allow for range-continuation. The next level-lower would be the swing-low from late-March, and below that we’d have the 61.8% Fibonacci retracement of the 2014-2017 major move, as this level helped to quell the USD down-trend after the January sell-off and remains as long-term support in DXY.
US DOLLAR FOUR-HOUR CHART: DEEPER SUPPORT POTENTIAL WHILE RANGE REMAINS

Chart prepared by James Stanley
EUR/USD MOVES UP TO RESISTANCE
Much like the US Dollar, the multi-month range remains alive and well in EUR/USD. As we open a fresh week, prices are near the resistance side of this range, making for a challenging position for bulls as we’re catching a bit of resistance below last week’s highs.


