Fundamental Forecast for GBP: Neutral
BRITISH POUND TRENDS MOVE FROM FEAST TO FAMINE IN 2018
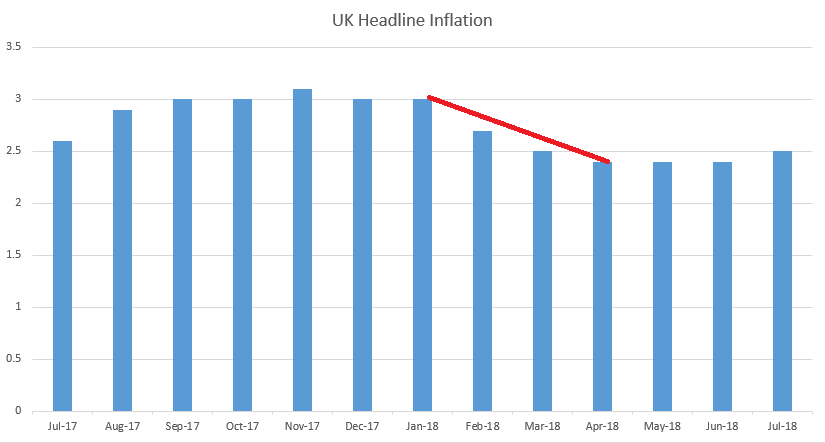
It’s been a rocky past four months for the British Pound. Coming into the month of April, the currency was flying high on the expectations of tighter policy and higher rates out of the Bank of England. This was largely in response to the rather persistent gains that had shown in inflation, with the latter portion of 2017 starting a run of five consecutive months at-or-above 3%. And while this brought upon a rate hike out of the BoE in November of last year, inflation remained strong and it appeared as though the bank would need to make further adjustments to temper price growth back towards their 2% goal.
But in mid-April, just a couple of weeks ahead of that rate decision at the BoE, evidence of falling inflation began to appear. March inflation numbers released in mid-April disappointed, coming in at 2.5%, and in short order, a reversal had started to show in GBP as markets factored in the potential for a no-hike rate decision in May. By the time the rate decision took place, GBP/USD had already fallen back to the 1.3500 area; and the dovish outlay at the meeting came as no surprise with price action just sitting on support around the 1.3500 handle in the days after the decision.
UK INFLATION FALLS BELOW 3% AND MAINTAINS SUBDUED FROM PRIOR HIGHS

Chart prepared by James Stanley
Three months later and inflation remains subdued. This didn’t stop the BoE from hiking rates in early-August, at their next ‘Super Thursday’ rate decision; but that’s appeared to matter little to the British Pound which has spent most of that period in some form of sell-off. A fresh yearly low printed in the pair just last week. This came in from the 23.6% Fibonacci retracement of the ‘Brexit move,’ which had also produced the 78.6% retracement that helped to mark the pair’s April high.
GBP/USD WEEKLY PRICE CHART: FIBONACCI RETRACEMENT FROM BREXIT MOVE HELPS TO SET APRIL HIGHS AND AUGUST LOWS


