The Canadian Dollar has continued to trade within the confines of the initial August opening range with news that a working US-Mexico trade deal has been negotiated sending USD/CAD to the monthly lows today in New York trade. Here are the updated targets and invalidation levels that matter on the USD/CAD charts this week.
USD/CAD DAILY PRICE CHART

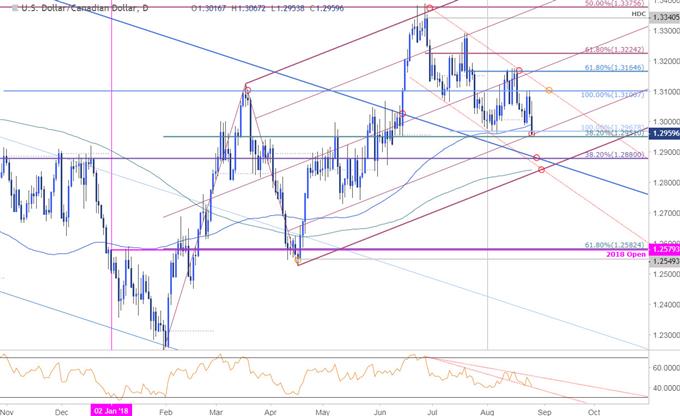
Technical Outlook: USD/CAD is testing key confluence support today 1.2951/68 – a region defined by the monthly opening range low, the 100% extension of the decline off the yearly high, the 38.2% retracement of the 2018 range and 61.8% parallel of the ascending pitchfork extending off the yearly lows.
A daily close below this level is needed to fuel the next leg lower in price with such a scenario targeting 1.2880 backed by a key confluence at ~1.2840s where the lower parallel converges on the 200-day moving average and channel support. Daily resistance stands at the 1.31-handle with broader bearish invalidation at 1.3165.
USD/CAD 240MIN PRICE CHART

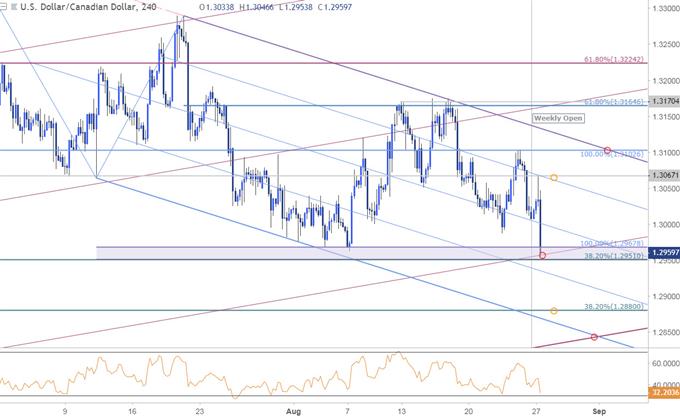
Notes: A closer look at USD/CAD price action further highlights this support zone- the immediate decline is at risk while above this threshold but the broader focus remains lower while within this descending pitchfork formation. Look for initial resistance at the median-line backed by 1.3067 and 1.31.
Bottom line: This is a make-or-break levels for USD/CAD near-term. From a trading standpoint, a good spot to reduce short exposure / bring in protective stops. I’ll favor fading strength sub-1.31 with a break lower targeting more significant structural support towards the lower parallel.
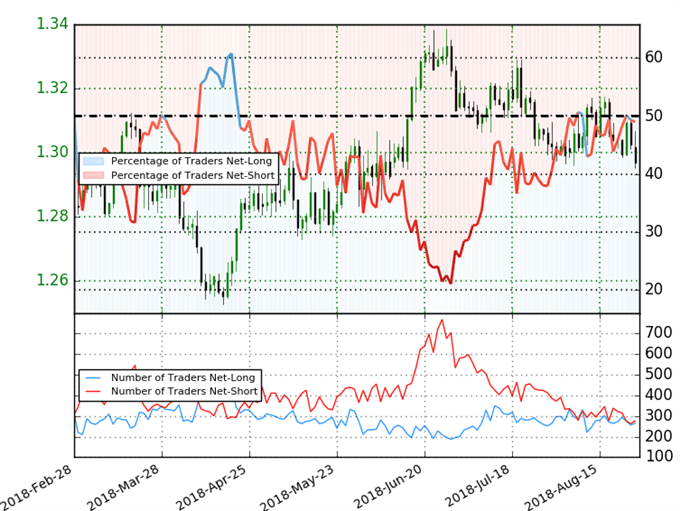
USD/CAD TRADER SENTIMENT


