GBP/USD
4 hour

Source: Admiral Markets MT5 with MT5 GBP/USD motive wave – 20 September 2018 at 4:00 AM GMT
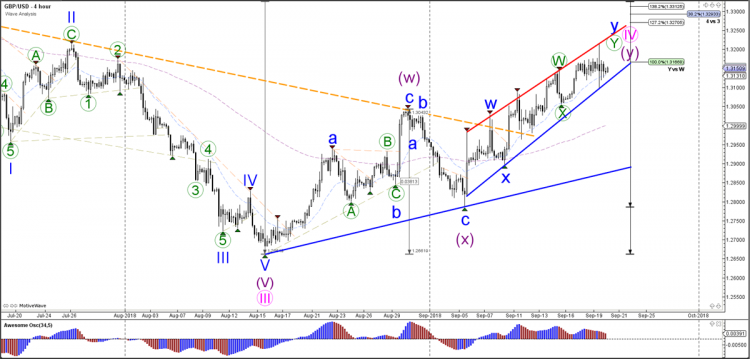
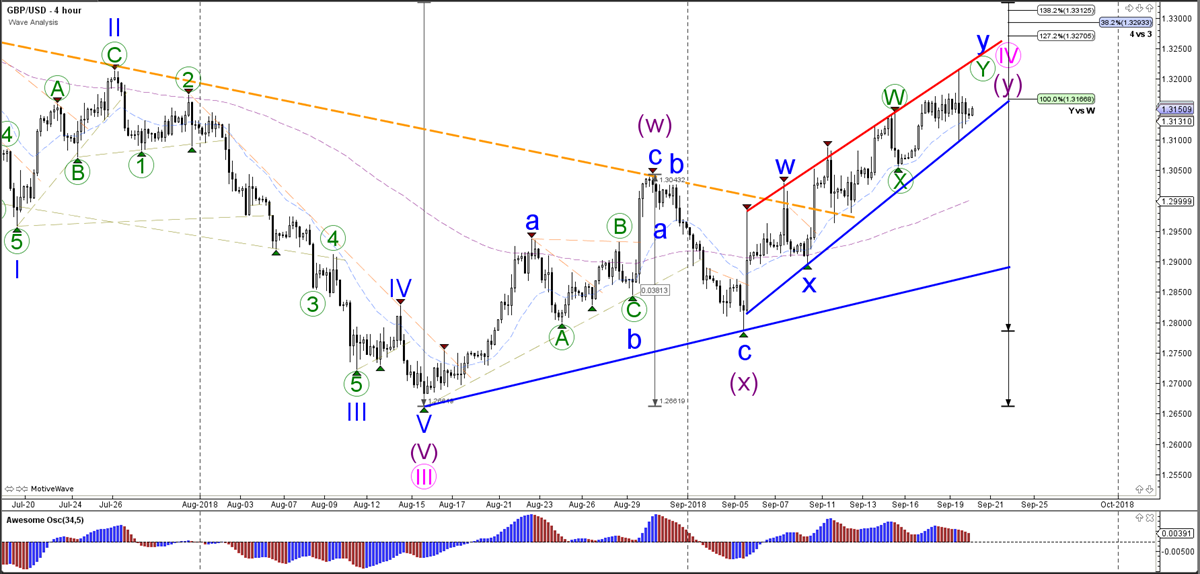
The GBP/USD tested and bounced at both the support (blue) and resistance (red) trend lines of the bullish trend channel. The price did not break below the channel; which is making a bullish continuation towards the Fibonacci levels, and this is the most likely scenario at the moment. A break below the channel could indicate the completion of the wave Ys at the recent high.
1 hour

Source: Admiral Markets MT5 with MT5 GBP/USD motive wave – 20 September 2018 at 4:00 AM GMT
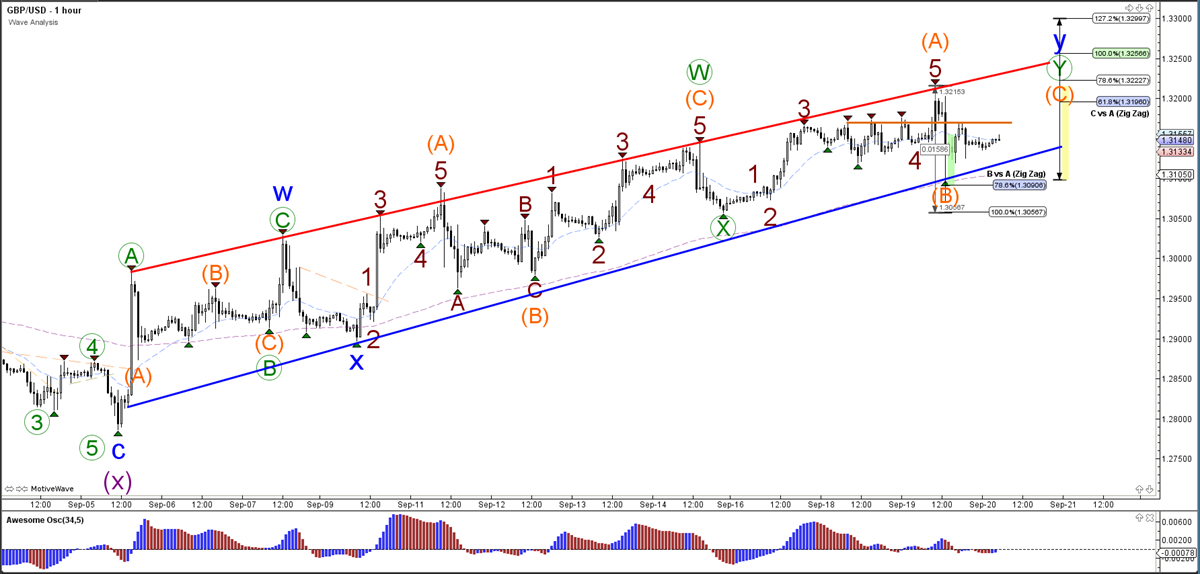
The GBP/USD seems to have finished 5 waves (dark red) within wave A (orange) and could be building a pullback within a wave B (orange). This wave B pattern could become invalidated if the price breaks below the bottom of wave B. A break above the resistance (orange) trend line could confirm a bullish breakout.


