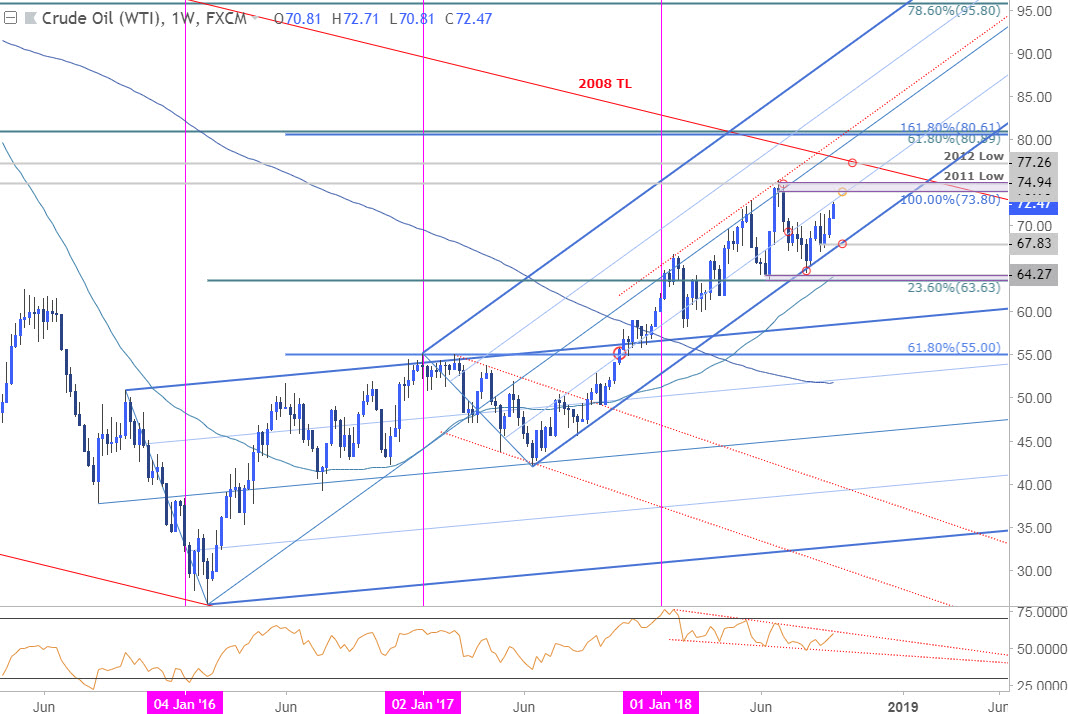
In this series, we scale-back and take a look at the broader technical picture to gain a bit more perspective on where we are in trend. Crude oil has rallied more than 11% off the August lows with prices now approaching topside resistance targets. Here are the key targets & invalidation levels that matter on the Crude Oil weekly chart.
CRUDE OIL WEEKLY PRICE CHART (WTI)

Notes: Crude oil has continued to trade within the confines of a well-defined ascending pitchfork formation extending off the 2016 lows with prices rebounding from support at the lower parallel last month. In my previous WTI price outlook, our bottom line stated that crude prices had, “responded to key longer-term structural support and leaves the risk-weighted to the topside while above 67.” The subsequent advance took out our final target at 71.14 yesterday with the price now testing parallel resistance at the 50-line.
A breach above this threshold targets key resistance at 73.80/94– a region defined by the 100% extension of the August advance, the yearly high-week close, and the 2011 low. Subsequent major resistance confluences are eyed at 77.26 and 80.61/89. Weekly support rests at 67.83 with broader bullish invalidation steady at 63.63.
Bottom line: Crude prices are eyeing slope resistance here and although we could see some pullback in the days ahead, the broader focus remains weighted to the topside while within this structure. From a trading standpoint, I’ll favor fading weakness while above 69 with a breach of the yearly highs needed to fuel the next leg targeting the 2008 trendline (red). Keep in mind we’re heading into the close of the month/quarter this week- tread lightly.
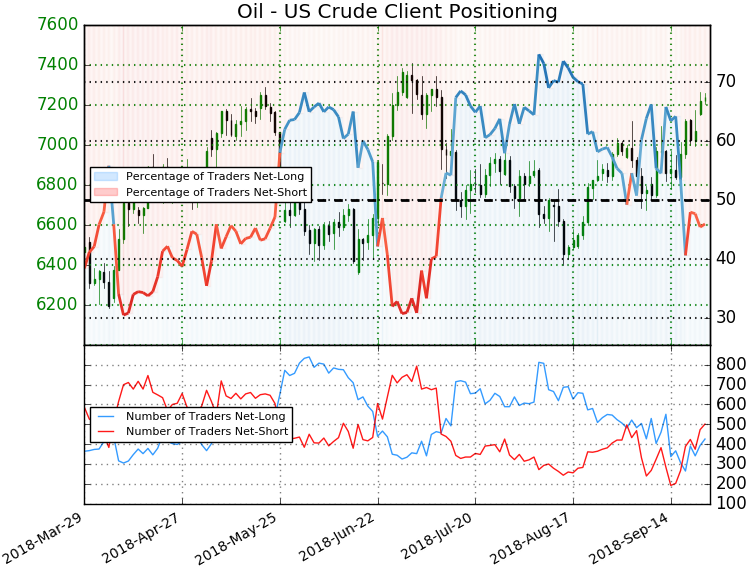
US CRUDE OIL TRADER SENTIMENT


